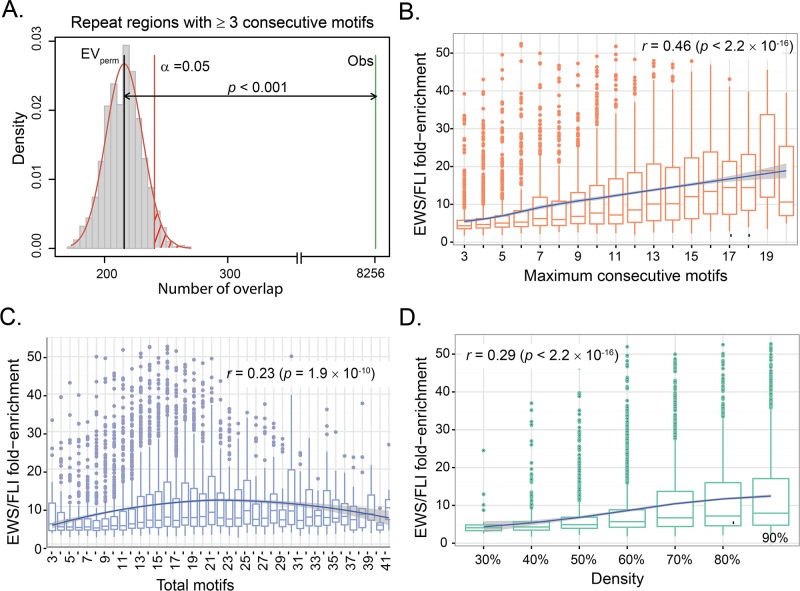
Fig 3. Characteristics of EWS/FLI-bound microsatellites.
(A) Permutation test shows that the number of EWS/FLI binding sites that overlap with repeat regions (n = 8,256) with minimum of 3 consecutive motifs is significantly higher than random chance (p < 0.001). Red line denotes the significance limit (α = 0.05). Gray bars represent the number of overlaps in the random regions with EWS/FLI binding sites in 1,000 permutations. The black line represents the mean of overlaps in random regions (EVperm) and the green bar is the actual number of overlaps observed in repeat regions (Obs). (B) Boxplot of EWS/FLI fold-enrichment (relative to genomic background) and number of consecutive motifs in EWS/FLI-bound microsatellites showing statistically significant increasing trend (p < 2.2 × 10⁻¹⁶). The blue line is the estimated LOESS regression line of the mean with the estimated 95% confidence bands (shaded region). (C) Boxplot of EWS/FLI fold-enrichment and total number of motifs in EWS/FLI-bound microsatellites showing a positive correlation (p = 1.9 × 10⁻¹⁰) and a non-linear trend (p < 0.05). The blue line is the estimated LOESS regression line of the mean with the estimated 95% confidence bands (shaded region). (D) Boxplot of EWS/FLI fold-enrichment and Density showing statistically significant positive correlation (p < 2.2 × 10⁻¹⁶). The blue line is the estimated LOESS regression line of the mean with the estimated 95% confidence bands (shaded region).

