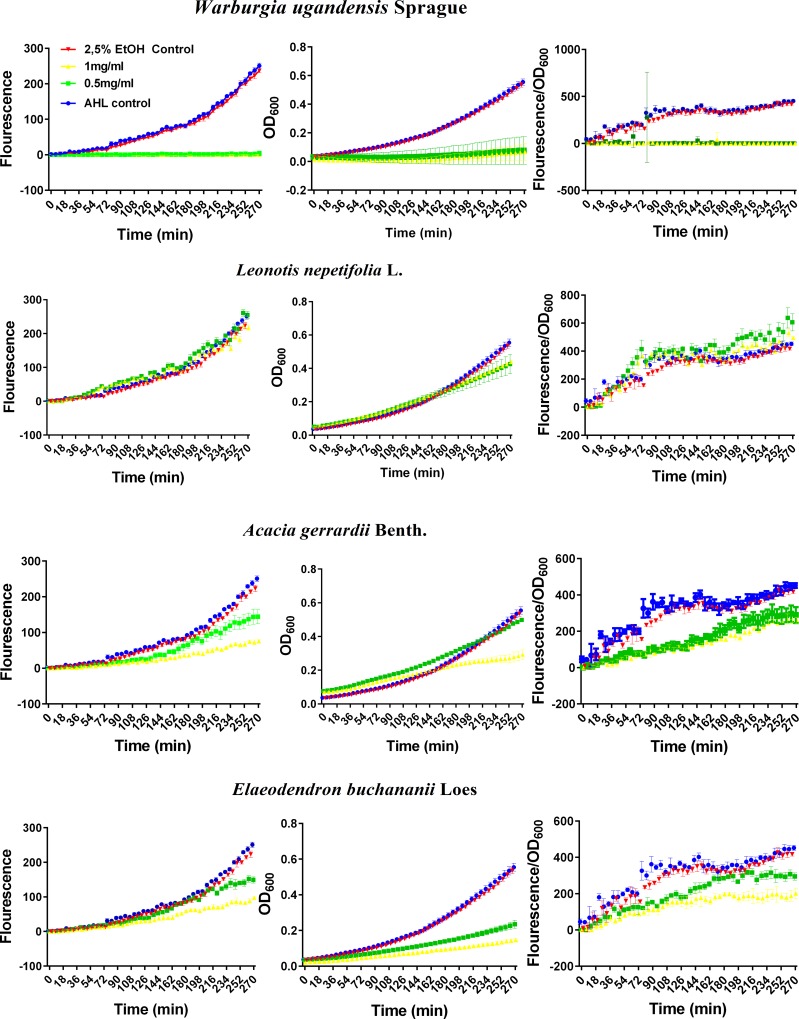
Fig 1. Representative plots of the evolution of the fluorescence (left panels), growth–as OD600- (center panels) and fluorescence intensity corrected for growth (fluorescence/OD600) (right panels) of E. coli strain Top 10 transformed with plasmid pSB1A3—BBa_T9002 after treatment with ethanol 50% (v/v) extracts of Warburgia ugandensis Sprague (Code P20), Leonotis nepetifolia L. (Code P9), Acacia gerrardii Benth. (Code P22) and Elaeodendron buchananii Loes (Code P21) applied at 0.5 and 1.0 mg/mL (as per legend in the top-left panel).
The E. coli quorum sensing response was induced by the addition of (3OC6HSL) to a final concentration of 0.5 nM. OD600 and fluorescence intensity were measured every six minutes with the appropriate parameters (fluorescence λex = 485 nm, fluorescence λem = 520 nm, integration time = 40 μs, number of flashes = 10, gain = 100, measurement mode = top). Data are mean values ± SD (n = 3).

