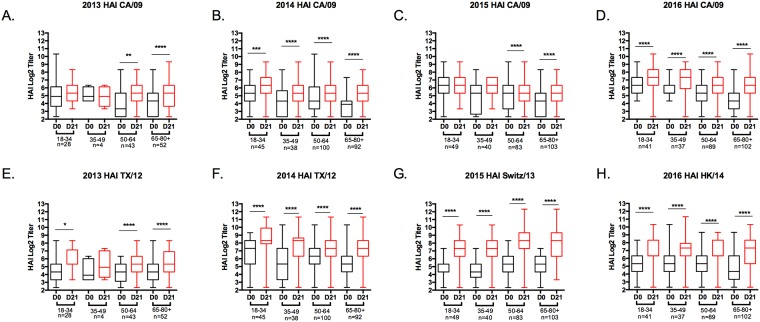
Fig 2. Hemagglutination inhibition (HAI) activity in serum antibody induced by Fluzone™.
HAI titers were determined from pre- and post-vaccination serum samples against H1N1 (A-D) and H3N2 (E-H). Values of each individual titer are the geometric mean titers plus standard errors of the means (SEM) (error bars). The box-and-whisker plots show the lower (Q1) and upper (Q4) quartile representing the IgG endpoint dilution titer for anti-HA antibodies. The diagram also shows the GMT for day 0 and day 21 post-vaccination for each age group against H1N1 (A-D) and H3N2 (E-H) components of the vaccine. The n value per age group is listed on the x-axis. Serum samples were tested (A and E) 2013 season, (B and F) 2014 season, (C and G) 2015 season, (D and H) 2016 season. *p≤0.05; *p≤0.01; *p≤0.001; *p≤0.0001.

