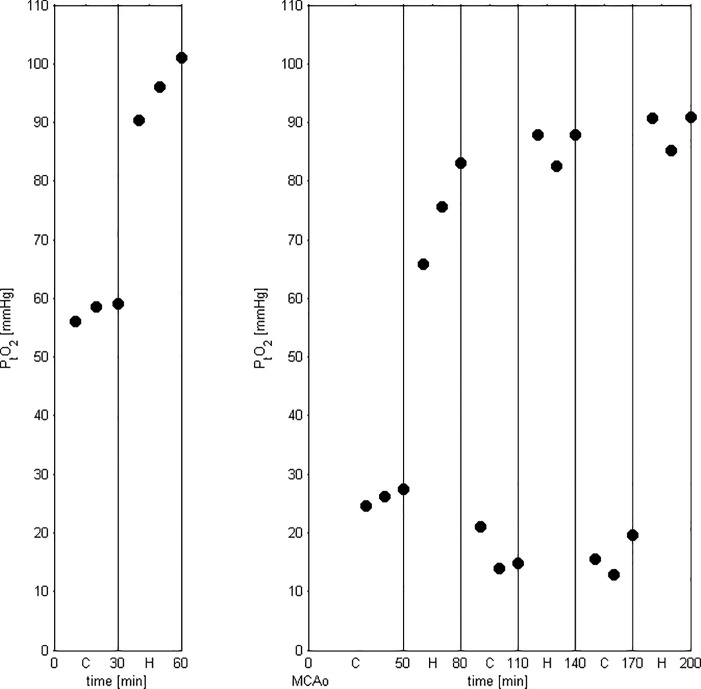
Fig 1. Graph showing PtO2 data from one subject to illustrate the experimental protocol.
First, following an equilibration period of 30mins after probe insertion (not shown), six PtO2 measurements were obtained in the non-ischemic (right) hemisphere (3 control, 3 under hyperoxia), then MCAo and PO2 probe insertion were carried out on the ischemic (left) hemisphere and PtO2 was measured every 10mins (again following a 30-min equilibration period after probe insertion) across three 30min control-hyperoxia cycles (18 measurements in total). Note the rapid equilibration in PtO2 after each change of oxygen condition, i.e., within the 10mins between measurements.

