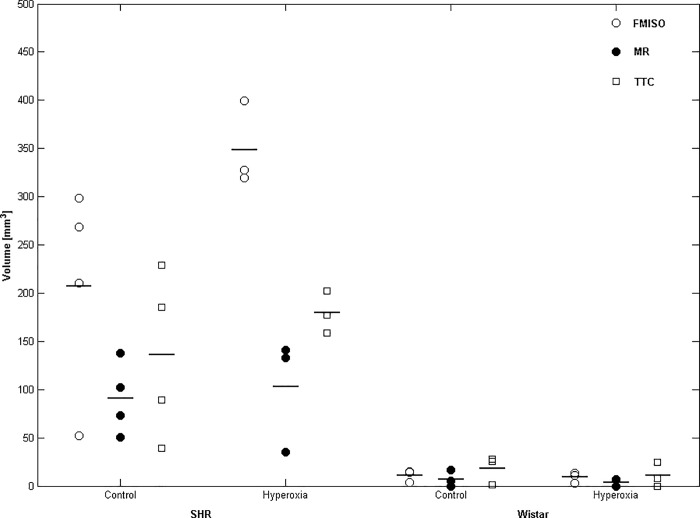
Fig 3. Individual and mean FMISO hypoxia, T2-weighted MRI and TTC lesion volumes for SHRs (left) and Wistar rats (right) under control and hyperoxia conditions.
Horizontal lines denote the mean of each group. FMISO, MRI and TTC lesion volumes were significantly larger in SHRs than Wistar rats in both conditions (see Results section for further details), but there was no significant effect of hyperoxia in either strain. Sample sizes are n = 3–4 per group.

