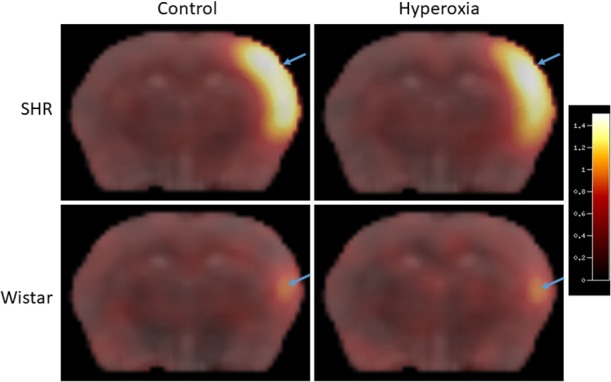
Fig 4. Representative FMISO SUV images overlaid on the same coronal slice of the co-registered MRI template for representative SHR (top row) and Wistar (bottom row) rats scanned under either the control (left column) or hyperoxia (right column) conditions.

The pseudocolor scale on the right represents SUV units (see text for details). This illustrates the much smaller FMISO lesion induced by distal MCA occlusion in Wistar rats than SHRs, and the lack of clear effect of hyperoxia on FMISO brain uptake in either strain (see Results for further details).
