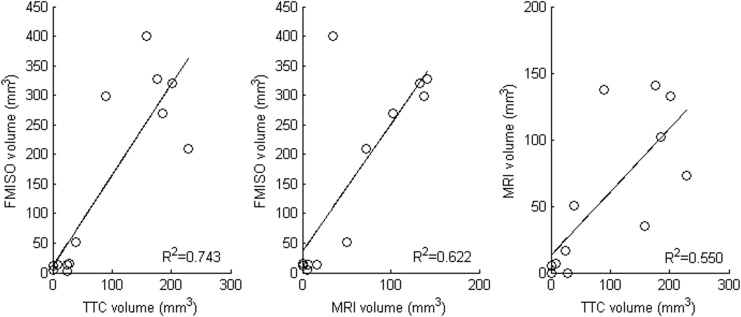
Fig 5. Relationships between FMISO hypoxic lesion volume, MRI lesion volume and TTC lesion volume.
Each plot uses data from both SHR and Wistar rats under both the control and hyperoxia conditions (n = 13). All Pearson correlations are statistically significant (p < 0.001; R2 values shown next to each scatterplot).

