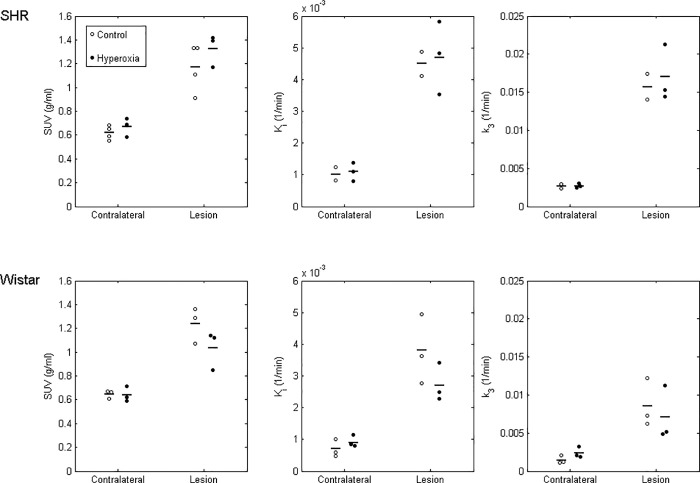
Fig 6. Individual and mean FMISO SUV (left column), influx rate (Ki; middle) and trapping rate (k3; right) in the FMISO lesion ROI and contralateral ROI for SHR (top row) and Wistar (bottom row) rats under the control and hyperoxia conditions.
Horizontal bars denote mean values. The Ki and k3 values were higher (significantly or with a strong trend) in the affected (‘lesion’) as compared to the non-ischemic (contralateral) hemisphere in both strains and both conditions (see Results section for details). However, there was no significant effect of hyperoxia on SUV, Ki or k3 in either strain.

