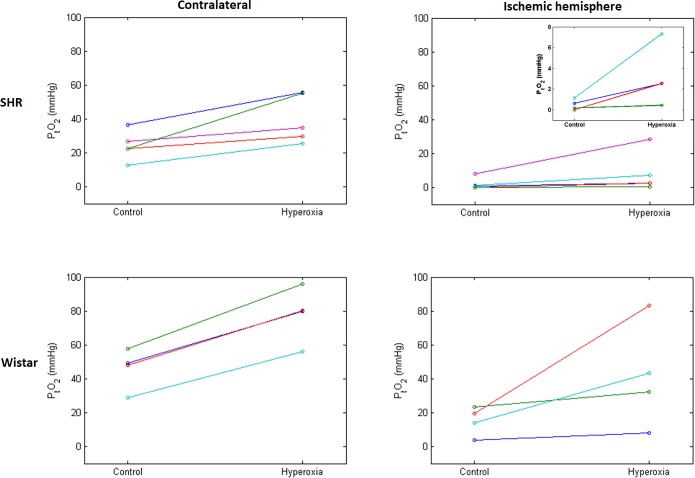
Fig 8. Individual cortical PO2 (PtO2) measured in the MCA territory in the non-ischemic hemisphere (left) and ischemic hemisphere (right) under the control and hyperoxia conditions in SHR (top) and Wistar rats (bottom; n = 5 and 4, respectively).
Each line joins PtO2 values obtained under both conditions for a single rat; different colors are used for ease of illustration. The inset on the top right zooms on the four SHRs with lowest baseline PtO2 values, which are difficult to discriminate on the main graph due to the common scale used across graphs. This figure shows lower PtO2 under ischemic vs control condition in both strains, and increases in PtO2 under hyperoxia in all 9 rats (although of very small amplitude in one SHR), which was highly statistically significant with pooled data. However, due to small samples and highly variable PtO2 increases, only trends were found when strains were assessed separately. The increase in PtO2 by hyperoxia was not significantly different between the two strains in the ischemic cortex, although was significantly higher for Wistar rats in the contralateral hemisphere. Statistical tests also showed significantly higher PtO2 in the control condition in Wistar rats as compared to SHRs in both hemispheres (see Results for further details).

