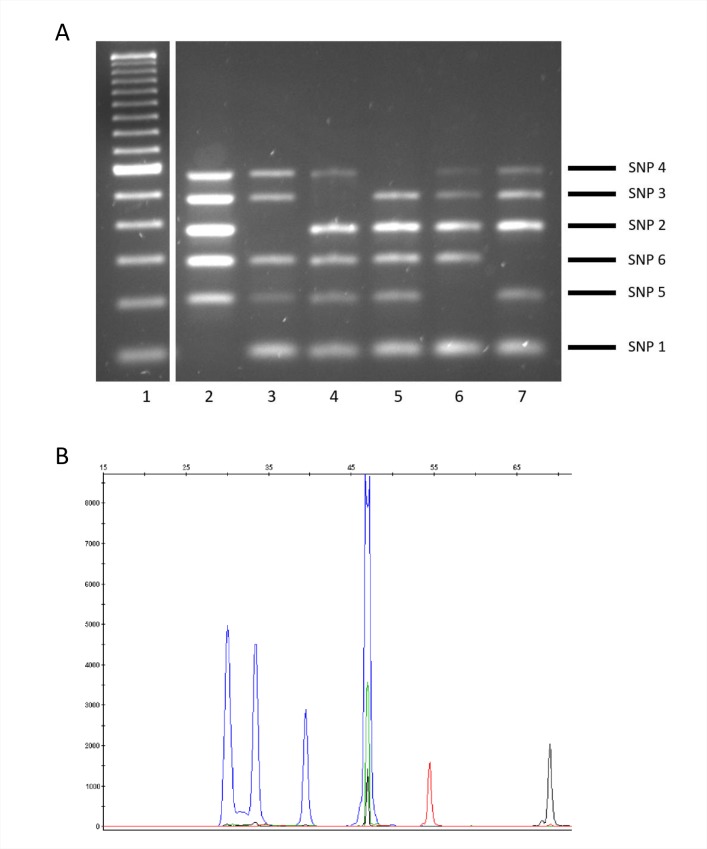
Fig 3. Patterns obtained when multiplex ASO-PCR (panel A) or SNaPshot (panel B) was applied on crude extracts from stored isolates.
(A) lane 1: 100-bp ladder, lanes 2–7: lineages 1, 2, 3, 4, 5, and 6. The amplicon corresponding to each lineage marker SNP and its size are shown on the right side of the gel. (B) Representative result for lineage 3.

