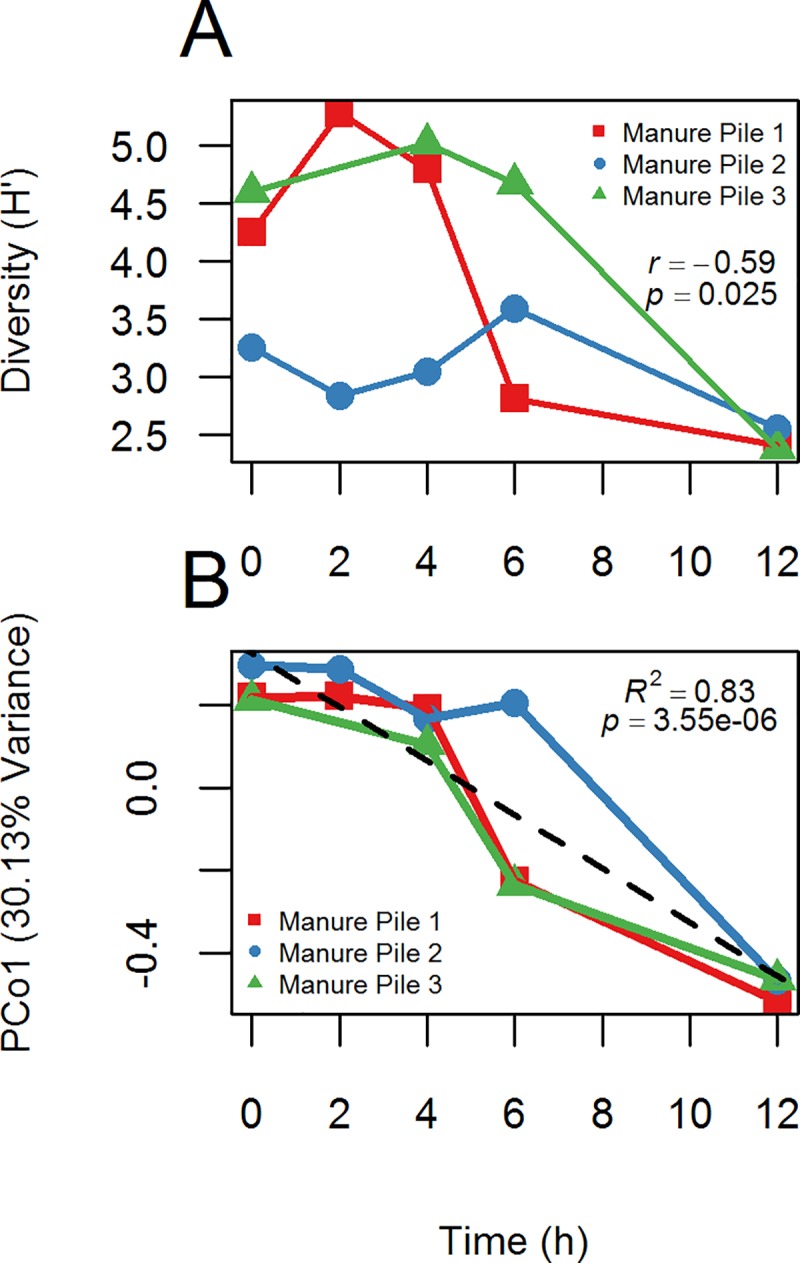
Fig 3. Changes in microbial composition with time.

(A) Changes in Shannon diversity (H’) with time. (B) Plot of community composition (PCoA, PCo1) changes with time using Bray-Curtis dissimilarity and 97% similarity OTUs.

(A) Changes in Shannon diversity (H’) with time. (B) Plot of community composition (PCoA, PCo1) changes with time using Bray-Curtis dissimilarity and 97% similarity OTUs.