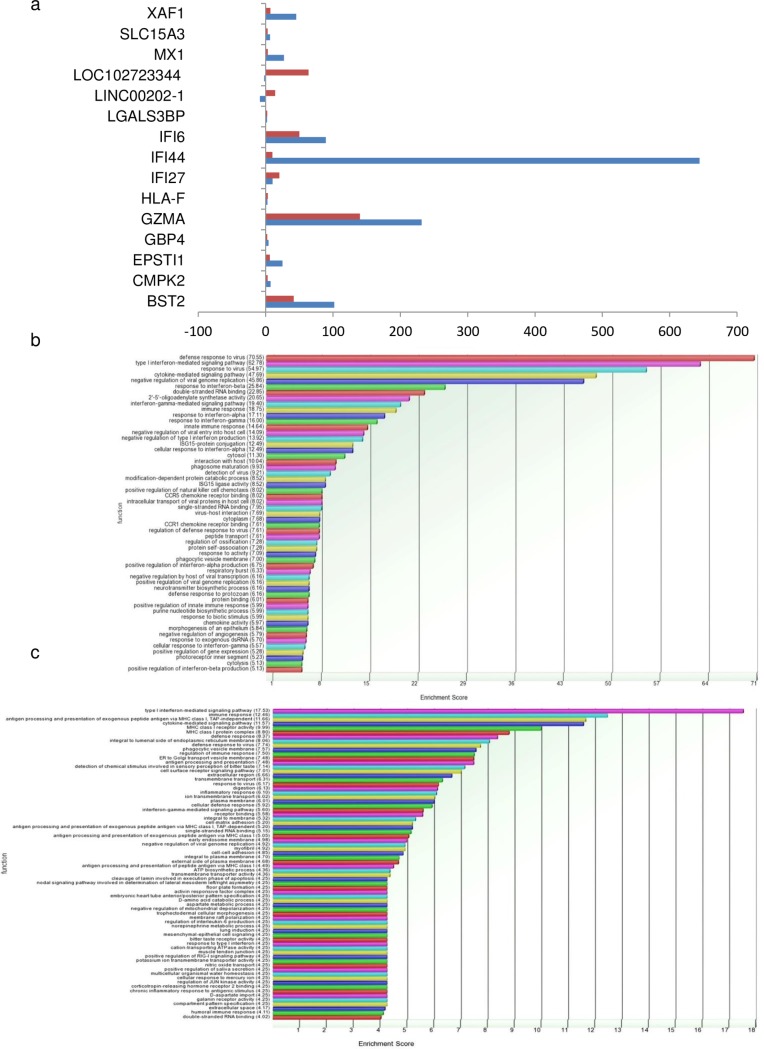
Fig 1. Graphical representation of RNA sequencing results.
a. Bar chart representing fold changes of 15 mRNA/lncRNAs, differentially expressed in both 24 and 72 hr samples. Bars in blue and red represent fold change values of each gene at 24 and 72 hr respectively. b. Bar chart representing the major pathways observed to be enriched in Huh7 cells 24hrs post HEV transfection.c. Bar chart representing the major pathways observed to be enriched in Huh7 cells 72hrs post HEV transfection.

