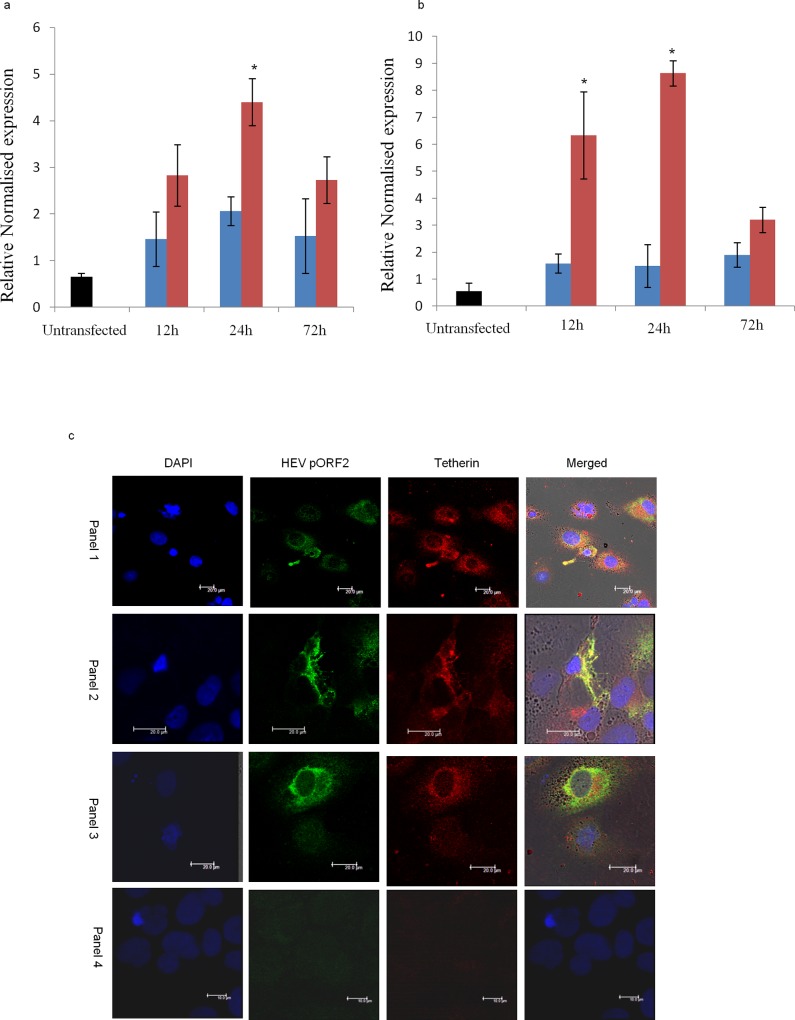
Fig 2. BST2 (Tetherin) and BISPR expression in HEV transfected Huh7 cells.
a. Bar chart representing BST2 (Tetherin) RNA levels in untransfected (black), wild type HEV replicon (red) and replication deficient HEV RNA (blue) transfected Huh7 cells at 12, 24 and 72 hrs post transfection. Relative expression values have been normalised with respect to GAPDH gene (n = 3; error bars represent standard deviation, *p value <0.01). b. Bar chart representing BISPR RNA levels in untransfected (black), wild type HEV replicon (red) and replication deficient HEV RNA (blue) transfected Huh7 cells at 12, 24 and 72 hrs post transfection. Relative expression values have been normalised with respect to GAPDH gene (n = 3; error bars represent standard deviation, *p value <0.01). c. Confocal images (40x objective) representing dual Immunofluorescence colocalisation patterns of HEV pORF2 and BST2 (Tetherin) in HEV transfected Huh7 cells in replicate samples (panels 1, 2: cytoplasmic and membranous, 3: perinuclear), 24hrs post transfection. Panels 4 represents staining pattern of untransfected Huh7 cells. Bars in panels 1–3 and 4 represent 20μm and 10μm respectively.

