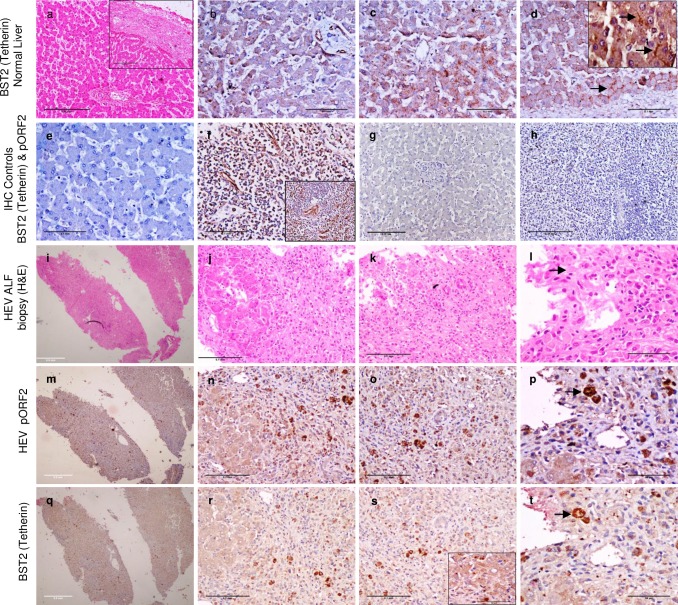
Fig 3. Representative images showing immunohistochemical expression of BST2 (Tetherin) and HEV pORF2 in vivo.
Expression of BST2 (Tetherin) in histologically normal liver [a-d (inset in ‘a’ represents subcapsular region)], lymph node (f) and spleen (inset f). Blood vessels in liver (b) served as positive internal control for BST2 (Tetherin) staining. Hepatocytes show cytoplasmic (c) and canalicular staining (arrows in Fig d and inset Fig d). Figs ‘e’ (liver) and ‘h’ (spleen) represent negative IHC controls with secondary antibody only. Fig ‘g’ represents negative control for pORF2 staining in histologically normal liver. Figs ‘i-t’ depict immediate serial sections of HEV associated Acute liver failure tissue biopsy (ALF) stained with Hematoxylin and Eosin (H&E; i-l), anti-HEV pORF2 IHC (m-p) and anti-BST2 (Tetherin) IHC (q-t). Similar cell populations stained with both the antibodies (Arrows in Figs l, p and t). Inset in Fig ‘s’ depicts perinuclear staining of BST2 (Tetherin) in HEV associated ALF case. Images ‘i, m, q’ were taken with 4x objective (Bar = 0.5mm); ‘a, h, g’ with 10x objective (Bar = 0.25mm); ‘b, c, d, e, f, g, j, k, n, o, r, s’ with 20x objective (Bar = 0.1mm) and ‘l, p, t, inset d and inset s’ with 40x objective (Bar = 50μm).

