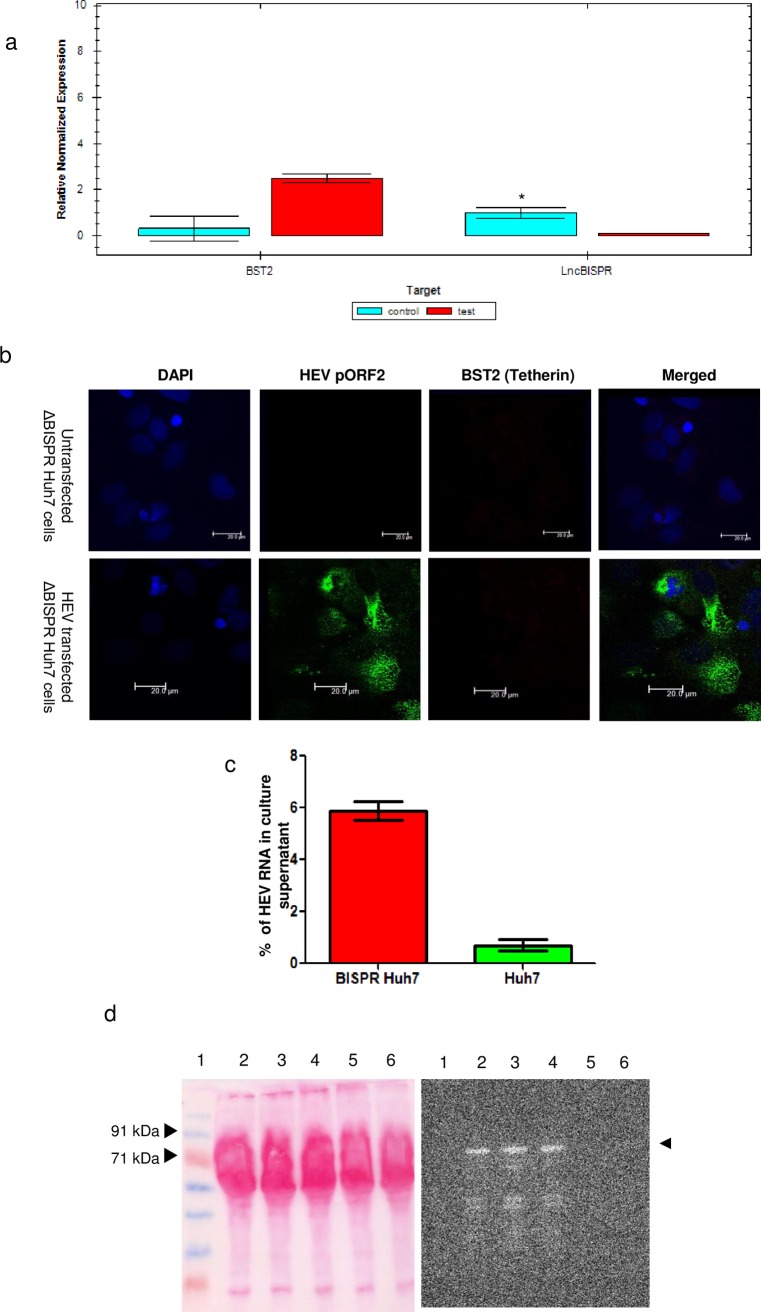
Fig 5. Analysis of HEV virion egress from ΔBISPR Huh7 cells.
a. Bar diagram showing expression of lncBISPR and BST2 (Tetherin) in HEV replicon transfected ΔBISPR Huh7 (test) 24 hrs post transfection and untransfected Huh7 cells (control) (n = 3; error bars represent standard deviation, *p-value <0.01). GAPDH was used as a reference gene for normalization. b. Confocal images (40x objective) representing staining patterns of HEV pORF2 and BST2 (Tetherin) in untransfected and HEV transfected ΔBISPR Huh7 cells, 24hrs post transfection. Bars represent 20μm. c. Bar diagram representing percentage of HEV RNA in culture supernatants of HEV transfected ΔBISPR Huh7 and Huh7 cells at 24 hrs post transfection (n = 3; error bars represent standard deviation). d. Ponceau-S and anti-HEV pORF2 stained western blot analysis of HEV virions in the culture supernatants of HEV transfected Huh7 (lane 6) and ΔBISPR Huh7 cells (lanes 2–4) 24hrs post transfection. Capsid protein pORF2 is shown by arrow heads. Lane 5 represents the negative control sample (culture supernatant from untransfected Huh7 cells). Lane 1 represents prestained protein molecular weight marker (Puregene, United States).

