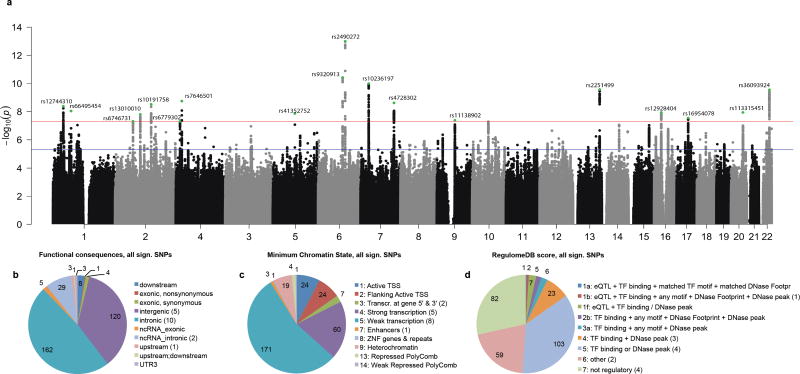
Fig. 2. Results of SNP-based meta-analysis for intelligence based on 78,308 individuals.
Association results from the GWAS meta-analysis pertaining to individuals of European descent. (a) Negative log10-transformed P-values for each SNP (y-axis) are plotted by chromosomal position (x-axis). The red and blue lines represent the thresholds for genome-wide statistical significant associations (P=5×10⁻⁸) and suggestive associations (P=1×10⁻⁵) respectively. Green dots represent the independent hits. (b) Functional categories for 336 genome-wide significant SNPs. (c) The minimum (most active) chromatine state across 127 tissues for 336 genome-wide significant SNPs. (d) The Regulome database score for 336 genome-wide significant SNPs. The lower the score the more likely it is that a SNP has a regulatory function. For b–d the numbers in brackets in the legends refer to the number of lead SNPs for that category.

