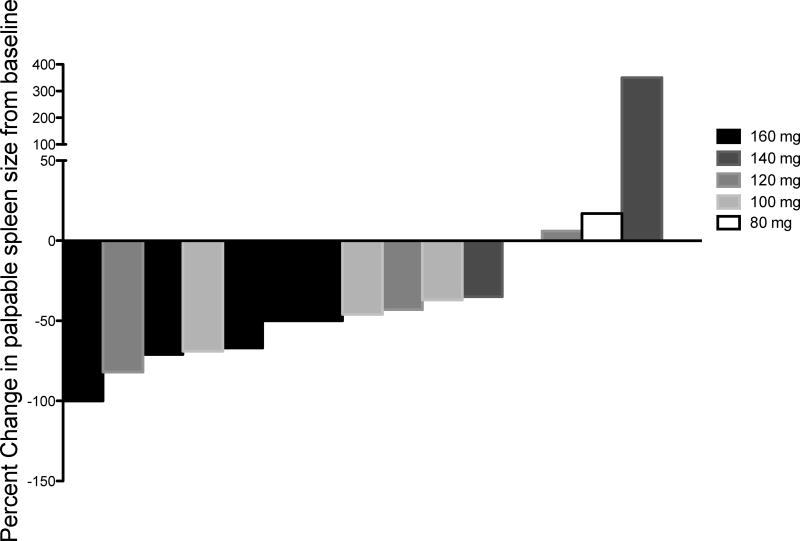
Figure 1. Percent change in baseline palpable spleen length at week 12.
Waterfall plot demonstrating percent change in palpable spleen length for each subject at week 12 and colored coded by dose level. A negative percent change indicates a reduction in spleen length. Fifteen patients with baseline palpable splenomegaly were evaluable for this analysis at week 12 of lestaurtinib treatment.

