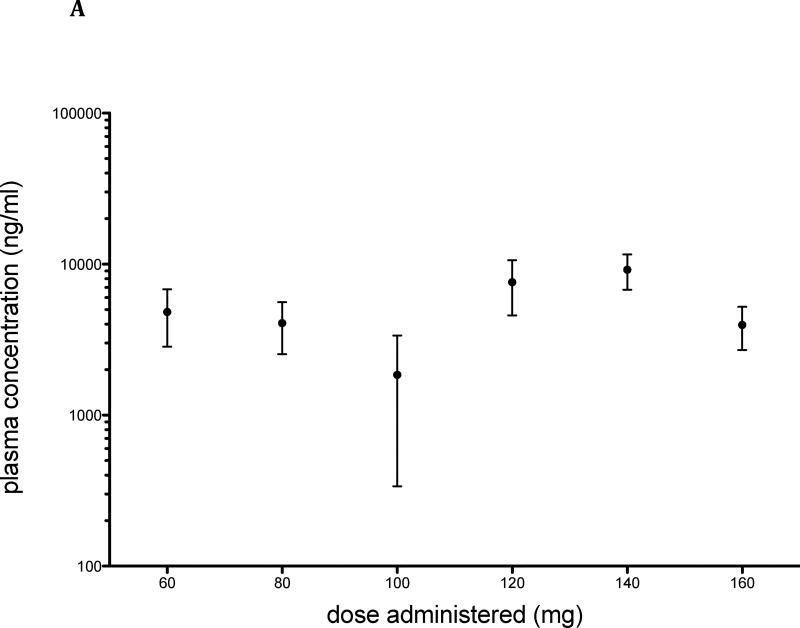
Figure 2. Plasma Concentration of lestaurtinib.
Trough levels of lestaurtinib were measured in treated patients by HPLC with fluorescence detection. A: Mean and standard error are presented for each dose administered at time of collection (n = 24: n=2 at 60 and 80 mg; 3 at 100 mg, 5 at 120 mg, 9 at 140 mg and 3 at 160 mg). B: Plasma concentration plotted against spleen response at 3 months (n=12; p = 0.2964).


