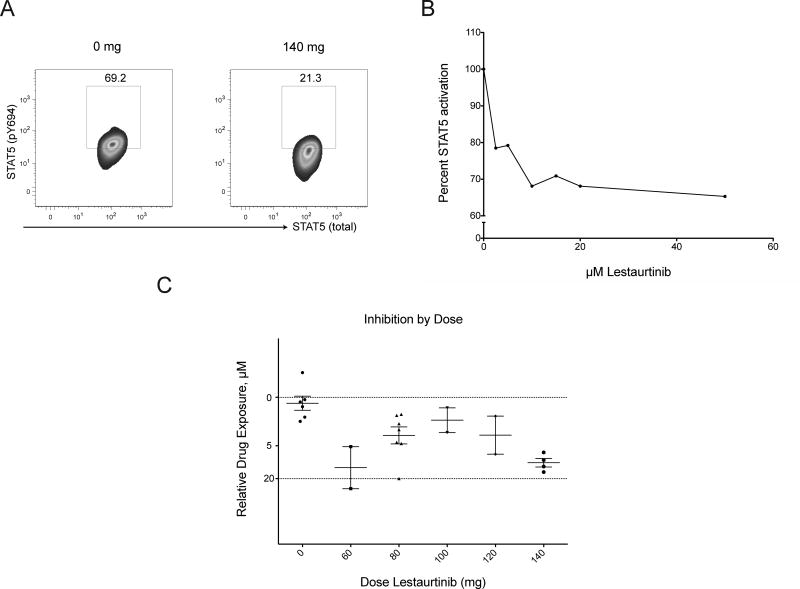
Figure 3. STAT5 Phosphorylation is variably inhibited at lower doses of lestaurtinib.
BaF/3 EPOR-GFP JAK2 V617F cells were incubated in patient plasma and pSTAT5 fluorescence intensity was measured (panel A). A corresponding standard curve was generated using thawed inhibitor-naive plasma from patients with varying concentrations of lestaurtinib added (final concentrations of 2.5 – 50 μM). PhosphoSTAT5 activation is represented as a ratio of treated to untreated cells, as measured by mean fluorescence intensity (MFI, panel B). Plasma samples (baseline and trough levels) collected at designated time points were measured in parallel (panel C): MFI values for study samples (n=20) were converted to a percent of untreated; lines represent mean with SEM at each dose level. Horizontal lines are derived from the standard curve.

