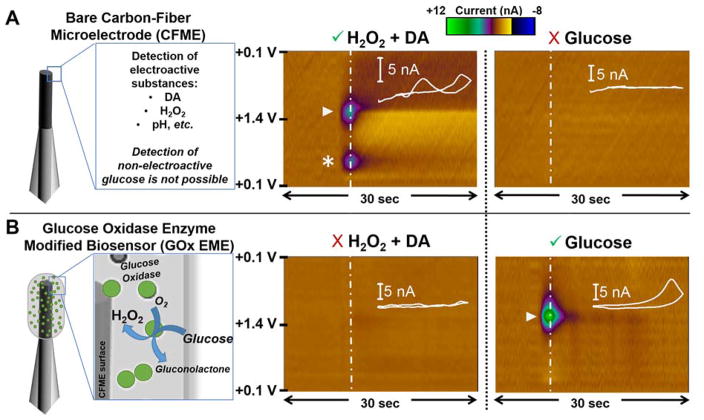
Figure 2.
Voltammetric Response of Carbon-Fiber Microsensors to Glucose, Dopamine and H2O2. (A) Left: Schematic representation of a bare CFME. Representative color plots depict current collected in response to the same solutions using a voltammetric waveform from +0.1 V to +1.4 V41. A mixture of 1000 nM DA (asterisk) and 50 μM H2O2 (triangle) is detected (middle), but the detection of non-electroactive glucose (0.8 mM) is precluded (right). (B) Left: Schematic of the GOx EME. Right: Representative color plots demonstrate the detection of glucose (triangle, indicated by the oxidation of enzymatically generated H2O2). However, there is insufficient sensitivity for the detection of physiologically relevant concentrations of H2O2 and DA (middle panel).

