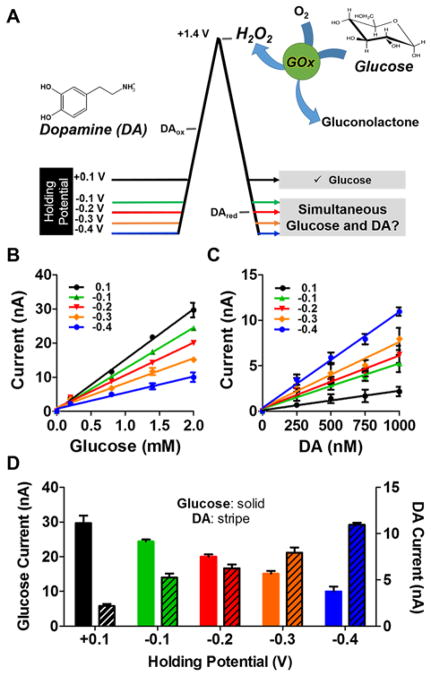
Figure 3.
Systematic Characterization of Holding Potential. (A) Investigation of a series of waveforms for the simultaneous voltammetric detection of glucose and DA with a GOx EME. (B) Glucose (0.2–2.0 mM) and (C) DA (250–1000 nM) calibration plots collected with the waveforms shown in (A). (D) The current collected in response to a sample containing 2.0 mM glucose and 1000 nM DA (note respective scales on left and right y-axes) is dependent on the holding potential applied between voltammetric scans. A −0.2 V holding potential provides a compromise that enables adequate detection of both analytes. One-way ANOVA analysis demonstrated all holding potentials were significantly different than the previously employed +0.1 V holding potential (glucose: F(4,20)=37.28, ***p<0.001 and DA: F(4,20)=70.23, ***p<0.001).

