
Figure 4.
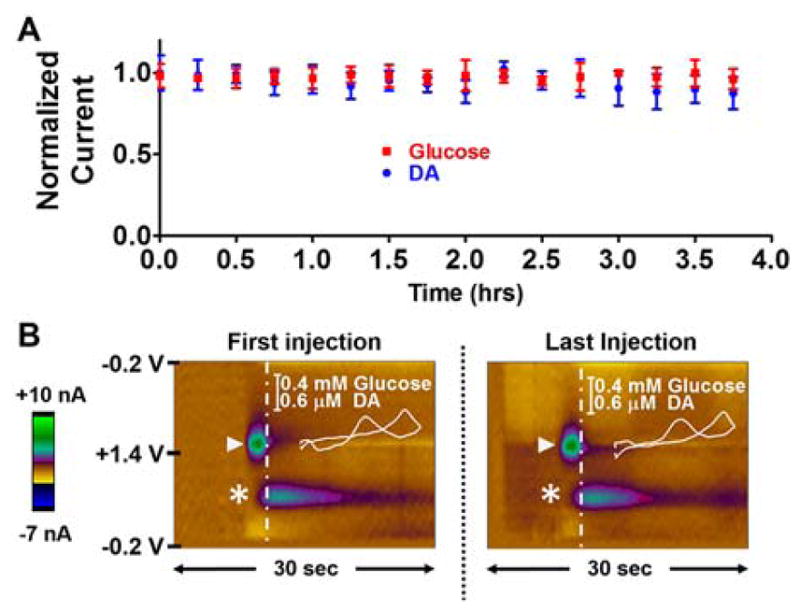
Microbiosensor Stability. (A) Normalized current collected in response to repeated bolus injections of a solution containing glucose (0.8 mM) and DA (750 nM). The peak current remained stable for glucose (F(16,48)=0.27, p>0.05) and DA (F(16,48)=0.60, p>0.05) over 4 hours. (B) Representative color plots for the first (left) vs last (right) injection. Analyte identification (glucose: triangle, DA: asterisk) is achieved using CVs extracted from the color plot at the time indicated by the vertical dashed line (inset).