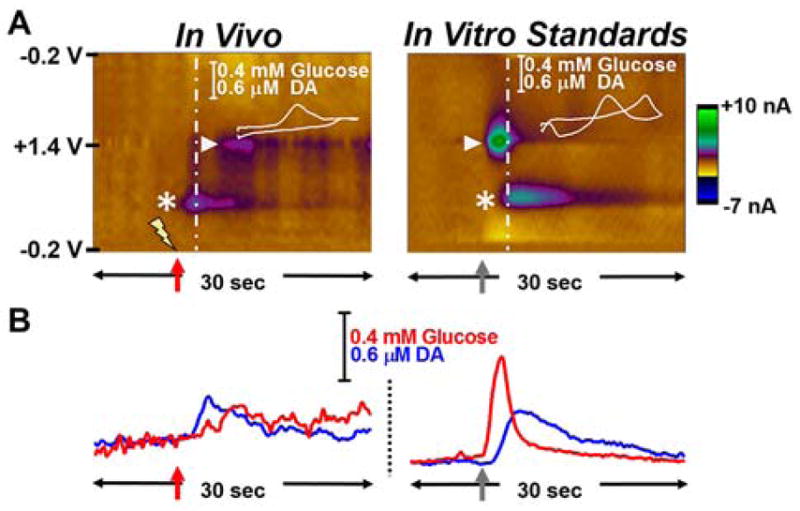
Figure 5.

Comparison of in vivo vs in vitro chemical dynamics. Representative data in the form of (A) color and (B) concentration vs time plots provide a visual comparison of the dynamics of glucose and DA detection. Left: When recording in the striatum of the anesthetized rat, electrical stimulation of the midbrain (60 Hz, 100–125 pulses, 200 μA, indicated by lightning bolt and red arrow) elicited DA release (asterisk) followed by an increase in extracellular glucose (triangle). Right: Glucose is detected prior to DA when a bolus of these standards is detected in vitro (sample delivery indicated by gray arrow). These data demonstrate that glucose availability responds to meet metabolic demand in the striatum following electrical stimulation of the midbrain.
