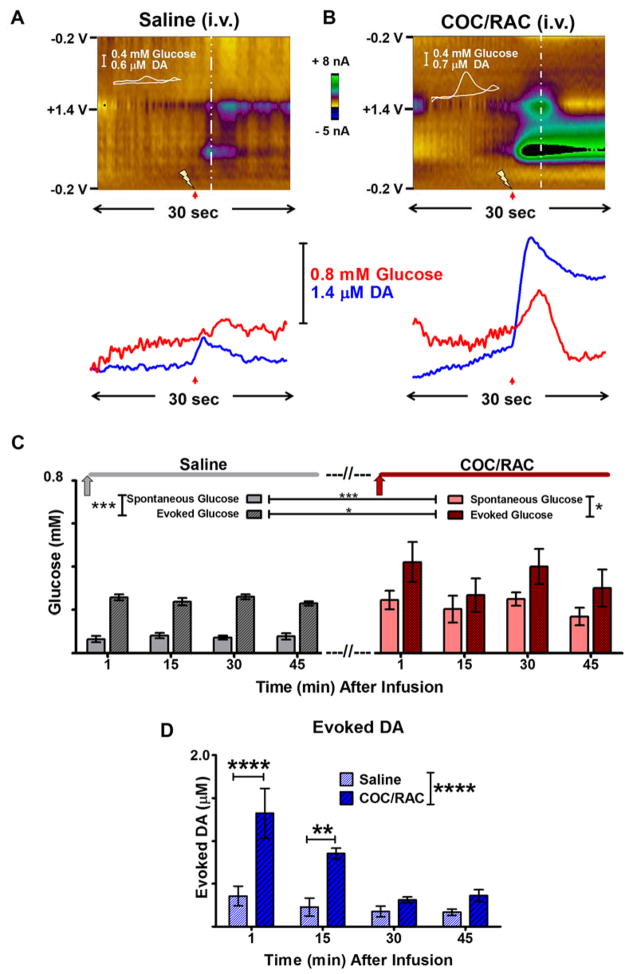
Figure 6.
Glucose availability is coupled with metabolic demand. Top: Representative color plots collected after i.v. infusion of (A) saline or (B) COC/RAC. The time of midbrain stimulation (60 Hz, 100–125 biphasic pulses, 200 μA) is indicated by the lightning bolt and red arrow. Bottom: Electrical stimulation evoked striatal DA release (blue) followed by local glucose influx (red), as evident in the concentration vs time profiles. (C) After saline infusion, electrical stimulation of the midbrain increased glucose influx to the recording site (dark gray v light gray), at all time points (***p<0.001). This trend held after treatment with COC/RAC (light red vs dark red, *p <0.05). COC/RAC treatment augmented spontaneous glucose influx to the sampling site (light gray vs light red, ***p<0.001). Electrical stimulation further increased extracellular glucose concentrations, as compared to electrically evoked glucose influx after saline administration (dark gray vs dark red, *p<0.05). (D) COC/RAC treatment significantly increased electrically evoked DA release at the 1 and 15 min time points when compared to saline (Bonferroni post hoc test, ****p<0.001, **p<0.01 respectively).

