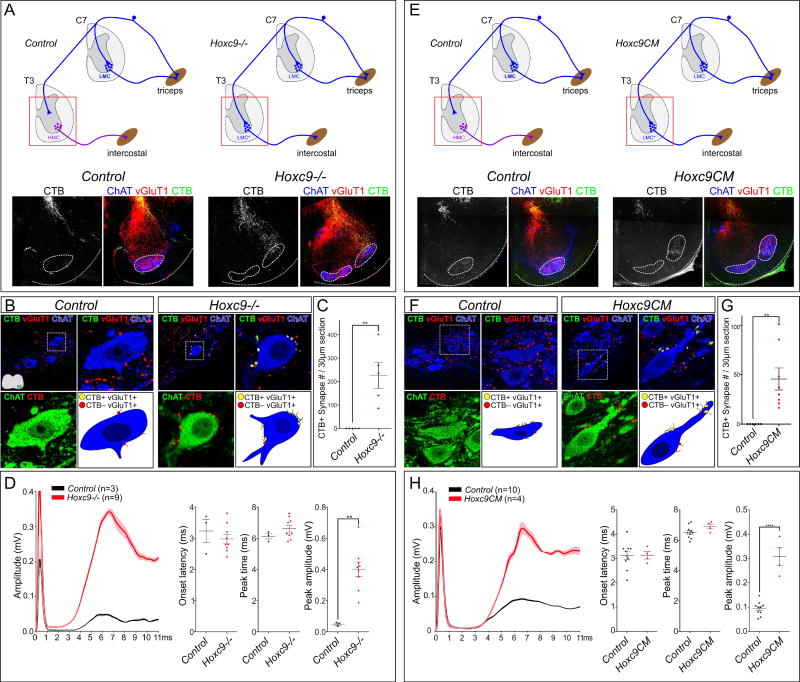
Figure 3. Limb pSNs Establish Synapses with Ectopic LMC Neurons in Hoxc9 Mutants.
(A) Localization of triceps pSN terminals in control and Hoxc9−/− mice at thoracic levels. Cervical pSN terminals were traced by injection of CTB into triceps muscles at P3 and examined at P5 at segment T3. (B) Triceps pSN terminals establish synapses on thoracic MNs in Hoxc9−/− mice. CTB+;vGluT1+ are observed on MNs, marked by ChAT. (C) Quantification of CTB+ terminals on MNs at segment T3. Total synapses were counted in 30 µm sections. Controls, n=5, 0±0 (mean±SEM); Hoxc9−/− mice, n=5, 225.9± 54.44; **p=0.0032. (D) Quantification of onset latencies (control, 3.23±0.37 msec; Hoxc9−/−, 2.99±0.15 msec), peak time (control, 6.13±0.18 msec; Hoxc9−/−, 6.62±0.22 msec), and peak amplitude (control, 0.05±0.01 mV; Hoxc9−/−, 0.40±0.05 mV; **p=0.0015. Bars on graphs show mean ±SEM. (E) CTB tracing of triceps sensory terminals in thoracic segments of control and Hoxc9CM mice. (F) Images of CTB traced triceps pSNs in thoracic segments. In Hoxc9CM mice, CTB+;vGluT1+ were observed on MNs. (G) Quantification of CTB+;vGluT1+ terminals on thoracic MNs in control and Hoxc9CM mice. Controls, n=6, 0±0 (mean ±SEM); Hoxc9CM, n=8, 45.48±11.09. Bars, mean ±SEM; **p= 0.0043. (H) Traces of T3 ventral root signals upon C7 dorsal root stimulation in control (n=10) and Hoxc9CM mice (n=4) at P6. Lines show mean ± SEM. Quantification of onset latencies (control, 3.12 ±0.17; Hoxc9CM, 3.13 ±0.153), peak time (control, 6.52±0.13; Hoxc9CM, 6.90±0.16), and peak amplitudes (control, 0.1±0.01; Hoxc9CM, 0.31 ±0.04; ****p<0.0001). Bars show mean ±SEM. See also Figure S3.

