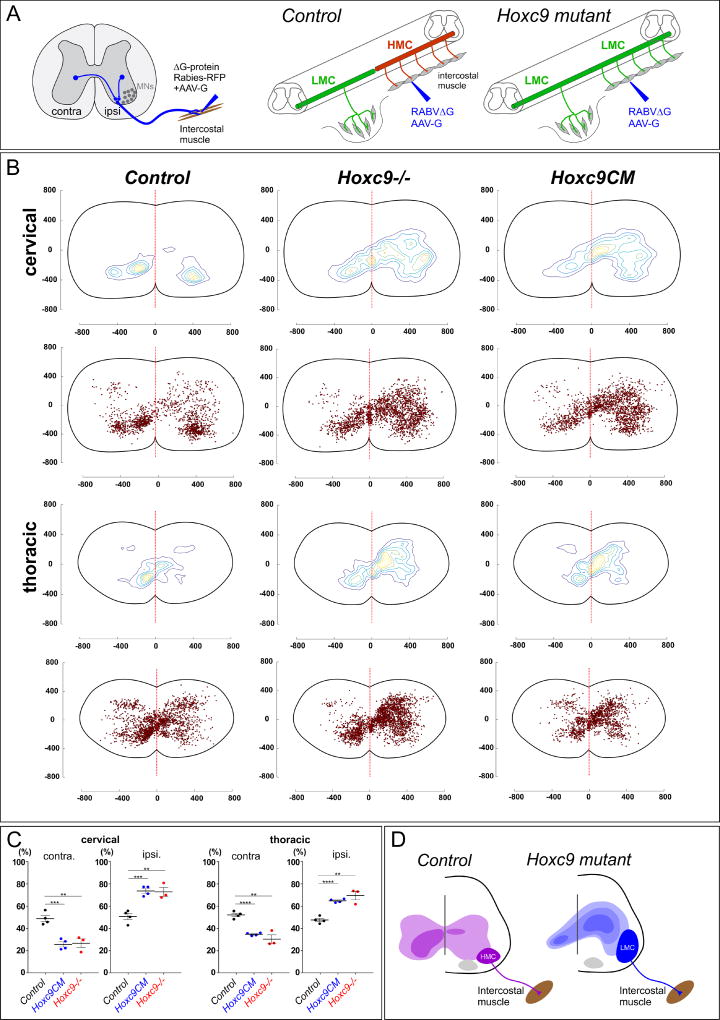
Figure 4. MN Columnar Identity Determines Premotor IN Input Pattern.
(A) Schematic of viral tracing strategy. AAV-G and RABVΔG-RFP viruses were co-injected into rostral intercostal muscles at P5 and examined at P13. (B) Contour plots representing labeled premotor INs position. The regions with the greatest labeling density are encircled with yellow line. Red dotted line indicates midline of the spinal cord. Distances (µm) from the central canal are shown on X–Y axes. Cervical regions (C1–C8) and thoracic regions (T1–T13) are shown separately. Labeled cell position is shown beneath contour plots. Total number of labeled neurons: Control, n=4 mice, 1385 cells (cervical), 1895 (thoracic); Hoxc9CM, n=4 mice, 1823 (cervical), 1412 (thoracic); Hoxc9−/−, n=3 mice, 2053 (cervical), 2325 (thoracic). (C) Quantification of ipsilateral vs. contralateral premotor populations at cervical and thoracic levels. Numbers represent averages from n=4 controls, n=4 Hoxc9CM mice, and n=3 Hoxc9−/− mice. **p<0.001, ***p=0.0001, ****p<0.0001. Bar graphs show mean±SEM. (D) Summary of changes in premotor labeling in Hoxc9 mutant mice. See also Figure S4.

