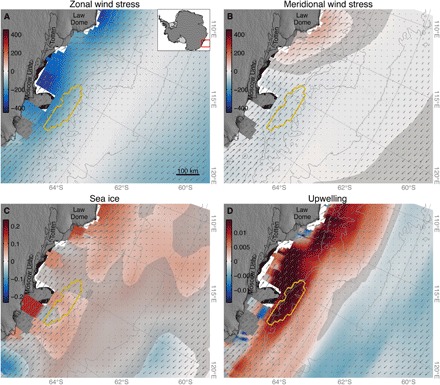
Fig. 3. Reanalysis fields and ice-shelf velocity.

(A to D) Regression coefficients of linear least-squares fits of TIS velocity and zonal wind stress [μPa/(m a−1)] (A), meridional wind stress [μPa/(m a−1)] (B), sea-ice concentration [%/(m a−1)] (C), and upwelling [(μm s−1)/(m a−1)] (D). All panels contain gray vectors representing mean wind velocity, gray 1-km bathymetric contours, and a gold polygon outlining the region of upwelling referred to in Fig. 2A. Gray shading denotes statistical insignificance at the 95% confidence level. Coefficients of determination are given in fig. S4.
