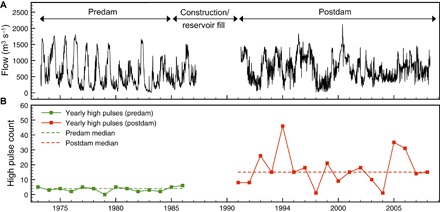
Fig. 2.

Streamflow (A) and pre- and post-dam high pulse count (B) at the Cachoeira Morena station, located 32 km downstream of the Balbina dam, illustrating severe dam-induced HA at this station after dam construction. Note that dam construction ended in October 1987. The subsequent period without data in the figure includes reservoir filling through March 1989, during which no water was released by the dam, as well as a period of missing data from 1989 to 1991.
