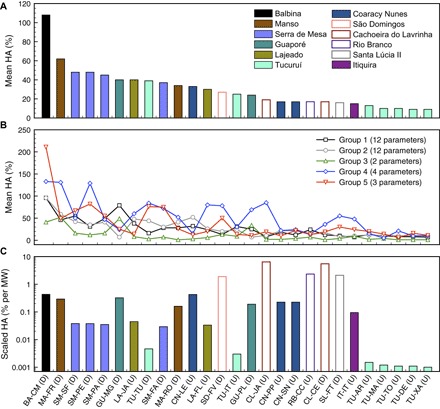
Fig. 5.

Summary of the overall magnitude (A) and type (B) of dam-induced HA observed across all dams and stations (see table S4 for dam/station naming conventions; U and D indicate upstream and downstream, respectively). Bars with the same color represent multiple stations affected by the same dam. (C) Scaling HA by electricity production capacity shows hydrologic impact (%) per megawatt, illustrating outsized impact of small dams (unfilled bars) and relative efficiency of particular dams, for example, Tucuruí (TU) versus Lajeado (LA), on the Tocantins River.
