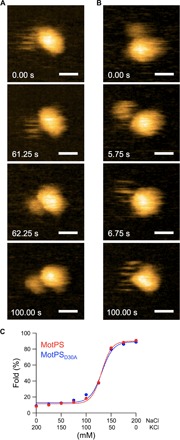
Fig. 3. Na+-induced structural transitions of the MotSC dimer.

(A) Real-time imaging of MotPS with exchanging the salt in the buffer from 150 mM KCl to 150 mM NaCl. MotSC became suddenly folded after approximately 60 s (second and third panels) from the solvent exchange indicated as 0.00 s (0 mM NaCl in fig. S5C). (B) Real-time imaging of MotPS with exchanging the salt from 150 mM NaCl to 150 mM KCl. MotSC became suddenly unfolded after approximately 5 s (second and third panels) from the solvent exchange indicated as 0.00 s (150 mM NaCl in fig. S5D). All images in (A) and (B) were recorded at 250 ms per frame in a scanning area of 50 nm × 50 nm with 150 pixels × 150 pixels. Scale bars, 10 nm. (C) Effect of NaCl concentrations on the structural transitions of the PGB domain of MotSC. At least 100 individual particles were analyzed under each condition. The data points were fitted by the Hill’s equation.
