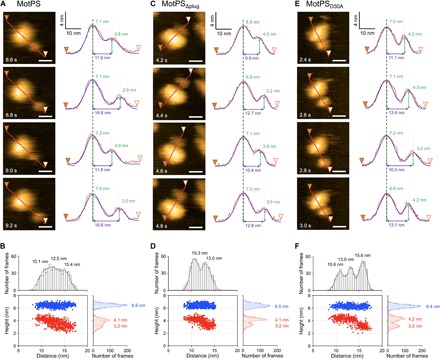
Fig. 4. Correlation between the center-to-center distance between the small and large domains and the domain heights.

Sequential HS-AFM images and their cross sections are shown for MotPS (A), MotPSΔplug (C), and MotPSD30A (E). All images were recorded at 200 ms per frame in a scanning area of 50 nm × 50 nm with 150 pixels × 150 pixels. Scale bars, 10 nm. Surface profiles along the line (from filled to open arrowheads) were fitted by two Gaussian functions, and the peak-to-peak distance and peak heights were measured. Distance versus height plots were generated for MotPS (B), MotPSΔplug (D), and MotPSD30A (F) from data points collected from more than 600 frames of 20 individual molecules. Blue and red dots are height data for the large and small domains, respectively. Histograms were fitted by multiple Gaussian functions.
