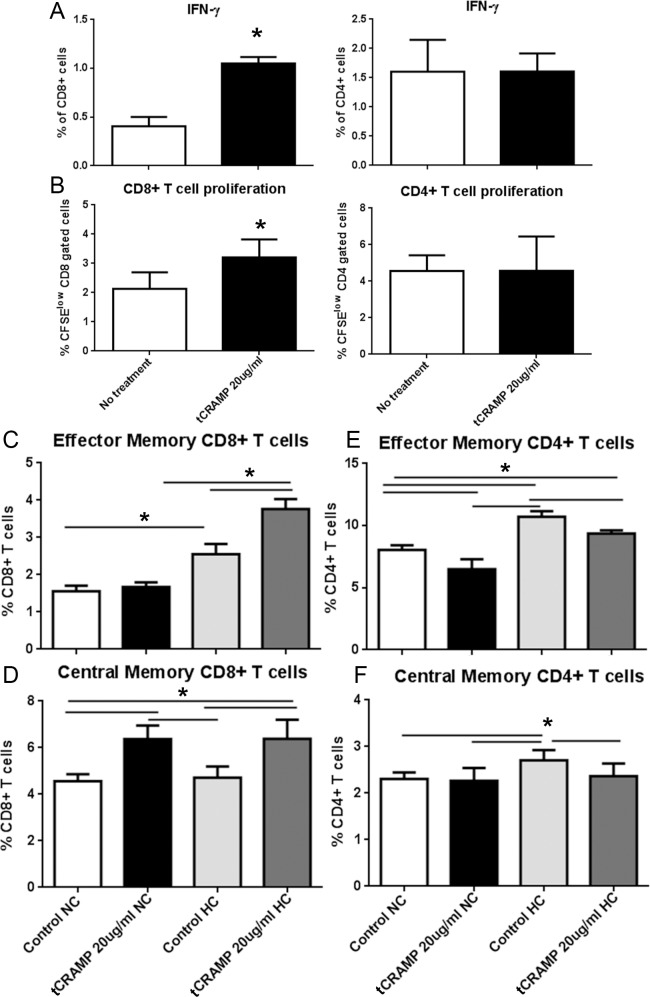
Fig 2. T cell response to tCRAMP and effect of high fat diet.
Splenocytes from 13 week old naïve ApoE(-/-) mice were stimulated with 20μg/ml truncated(t) CRAMP peptide for 48 hours (A) or stained with CFSE and stimulated with CRAMP 4 days (B) then stained for intracellular IFN-γ or analyzed for cell proliferation, respectively. CD8+ T cells are on the left panels and CD4+ T cells are on the right panels. *P<0.05; N = 4 each. Splenocytes from mice fed normal chow (NC) or a high fat diet (HC) for 6 weeks starting at 7 weeks of age were treated with 20μg/ml tCRAMP for 48 hours (C-F). Analysis of cell stains was based on the gating scheme depicted in S3 Fig. Bars over graph columns indicate statistical significance (P<0.05; N = 4 each).

