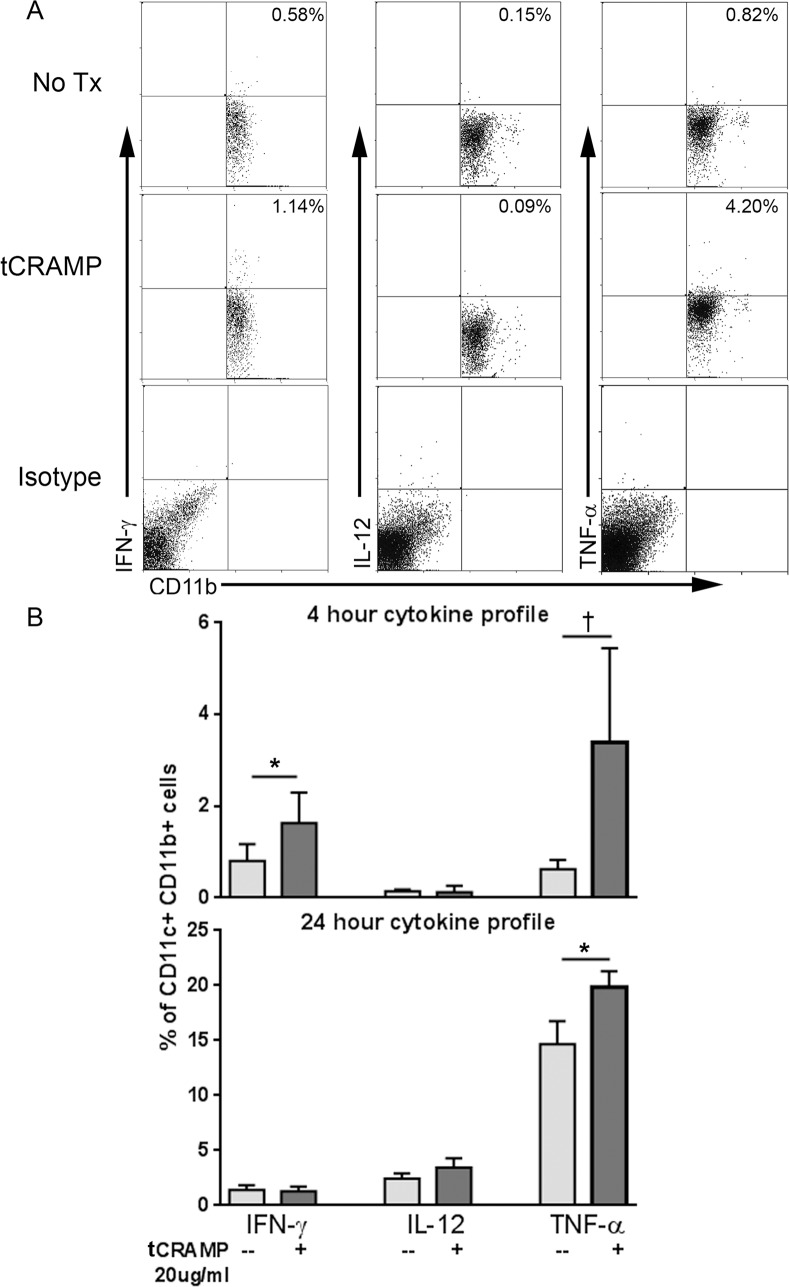
Fig 3. Inflammatory cytokine profile of CD11c+CD11b+ cDCs in mice fed high fat diet.
Splenocytes from naïve mice fed a high fat diet were treated with 20μg/ml tCRAMP for 4 or 24 hours and stained for intracellular cytokines. Isotype staining was used as control. Gating scheme for CD11c+ DCs as depicted in S5 Fig. Representative scatter plots are shown (A). Results were plotted on bar graphs (B). *P<0.05; †P = 0.08. Splenocytes pooled from 2 mice and assayed in triplicates.

