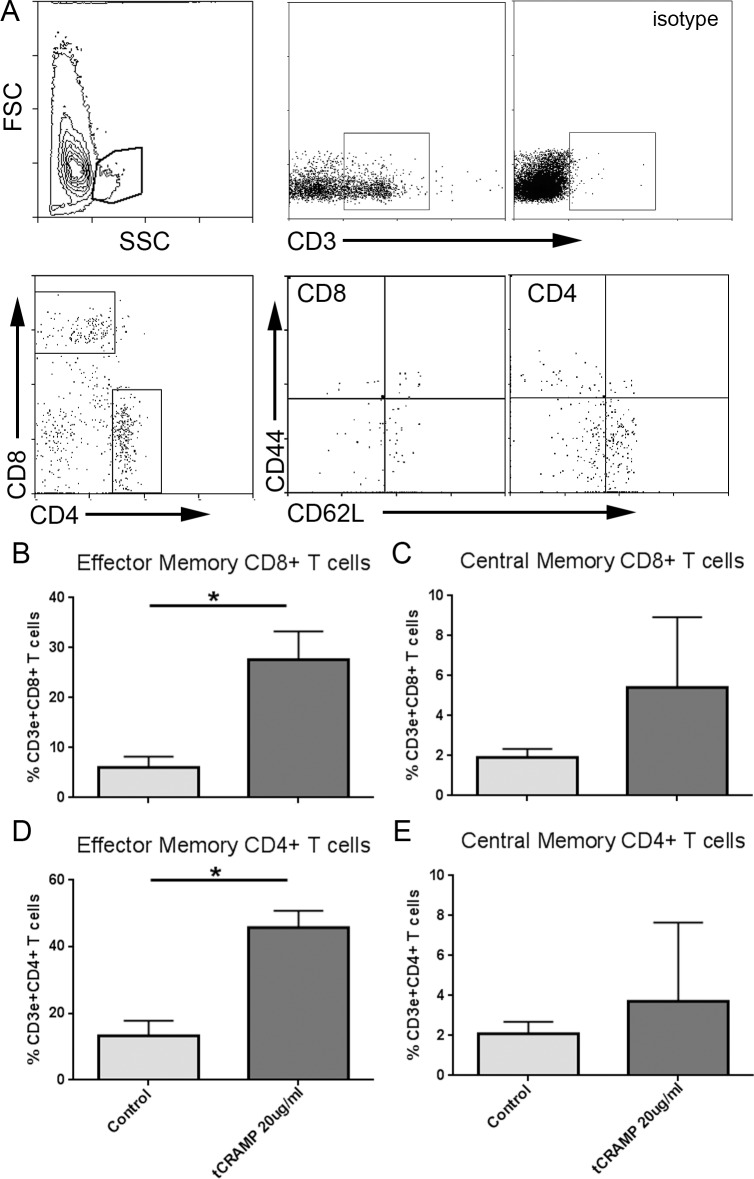
Fig 4. Plaque T cells are reactive to tCRAMP simulation.
Aortas from ApoE(-/-) mice at 25 weeks of age were subjected to enzymatic digestion and stimulated for 24 hours with 20μg/ml tCRAMP. Size gate is shown after inclusion of singlets and exclusion of non-viable cells, followed by gating for CD3+ T cells (A). Isotype was used as staining control. Cells were plotted on CD4 vs CD8 and selected for subtype analysis. Results were plotted on bar graphs (B-E). Aortas from 6 mice were pooled and assayed in triplicates. Bars over graph columns indicate statistical significance (P<0.05).

