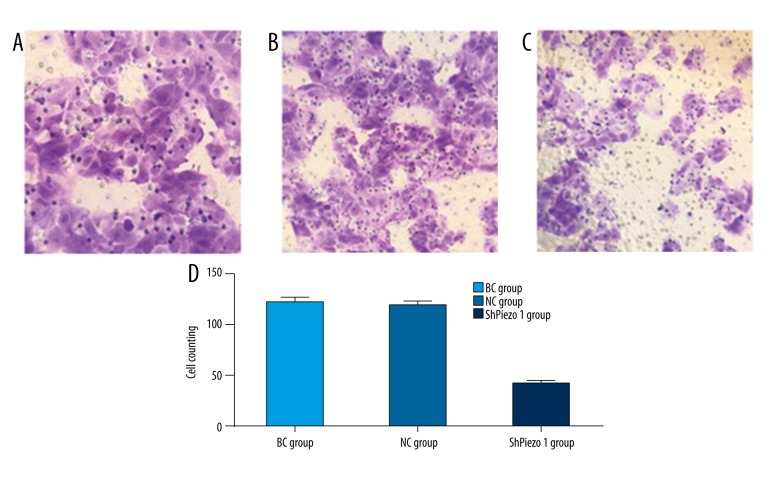
Figure 5.
The result of the Transwell experiment. (A) The blank group (BC group) (200×). (B) The negative control group (NC group) (200×). (C) The shPiezo1 group (200×). (D) The cell counts of the cells penetrating the membrane of the three groups. The results are presented as the means ±SD, n=3; ns means p>0.05 versus the control group; * p<0.05 versus the control group; ** p<0.01 versus the control group; one-way ANOVA.

