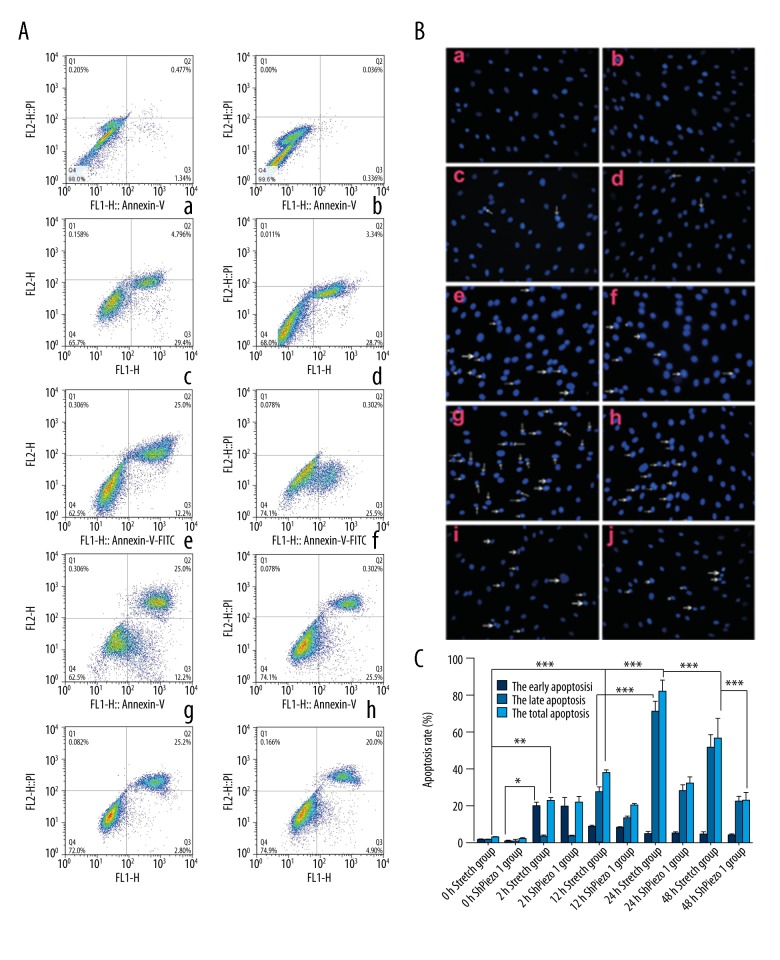
Figure 7.
(A) Images of nuclei shrinking and evident nuclear condensation of osteosarcoma (OS) cells (shown by arrowhead) after mechanical stretch forces of 0, 2, 12, 24, and 48 hours. Notes: (a) 0-hour group 200×. (b) 0-hour plus shPiezo1RNA group 200x. (c) 2-hour group 200×. (d) 2-hour plus shPiezo1RNA group 200×. (e) 12-hour group 200×. (f) 12-hour plus shPiezo1RNA group 200×. (g) 24-hour group 200×. (h) 24-hour plus shPiezo1RNA group 200×. (i) 48-hour group 200×. (j) 48-hour plus shPiezo1RNA group 200×. (B) Results of flow cytometry detection of 0S cell apoptosis in 0, 2, 12, 24, and 48 hours and shPiezo1RNA groups. Q1: (AnnexinV-FITC)−/PI+, necrotic cells. Q2: (AnnexinV-FITC)+/PI+, late stage apoptotic cells. Q3: (AnnexinV-FITC)+/PI−, early stage apoptotic cells. Q4: (AnnexinV-FITC)−/PI−, live cells. Notes: (a) 0-hour group. (b) 0-hour group plus shPiezo1RNA. (c) 2-hour group. (d) 2-hour group plus shPiezo1RNA. (e) 12-hour group. (f) 12-hour group plus shPiezo1RNA. (g) 24-hour group. (h) 24-hour group plus shPiezo1RNA. (i) 48-hour group. (j) 48-hour group plus shPiezo1RNA. (C) Early stage apoptosis of human OS cells in 0, 2, 12, 24, 48 hors and shPiezo1RNA groups. After a 2 hour mechanical stretch, the rate of early stage apoptosis significantly increased. After a 12 hour mechanical stretch, the late stage apoptotic rate increased and peaked in the 24-hour group. The late stage apoptotic rate was lower in the 48-hour group compared to the 24-hour group. The results are presented as the means ±SD, n=3; ns means p>0.05 versus the control group; * p<0.05 versus the control group; ** p<0.01 versus the control group; one-way ANOVA.

