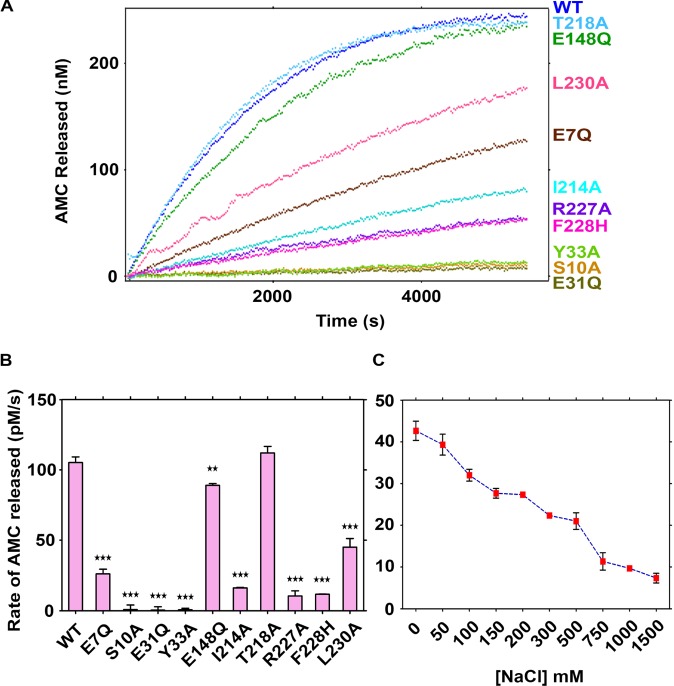
Figure 2. Hydrolysis of Ub-AMC catalyzed by BAP1N mutants.
Comparison of the enzymatic activity of wild-type BAP1N and the BAP1N variants E7Q, S10A, E31Q, Y33A, E148Q, I214A, T218A, R227A, F228H, and L230A. (A) Real-time reaction progress curves showing AMC released compared with time for the cleavage of Ub-AMC by wild-type BAP1N (blue) and BAP1N mutants are shown in different colors. The substrate and enzyme concentrations used for all reactions were 600 nM and 250 pM, respectively. (B) The rate of AMC hydrolysis calculated from initial slop of progress curve (P-value<0.05). (C) Dependence of enzyme velocity on the concentration of NaCl was determined for wild-type BAP1N. At each concentration of NaCl, values of initial velocities were calculated in triplicate. Final enzyme and substrate concentration in 100-μl reaction volume were 250 pM and 450 nM, respectively.

