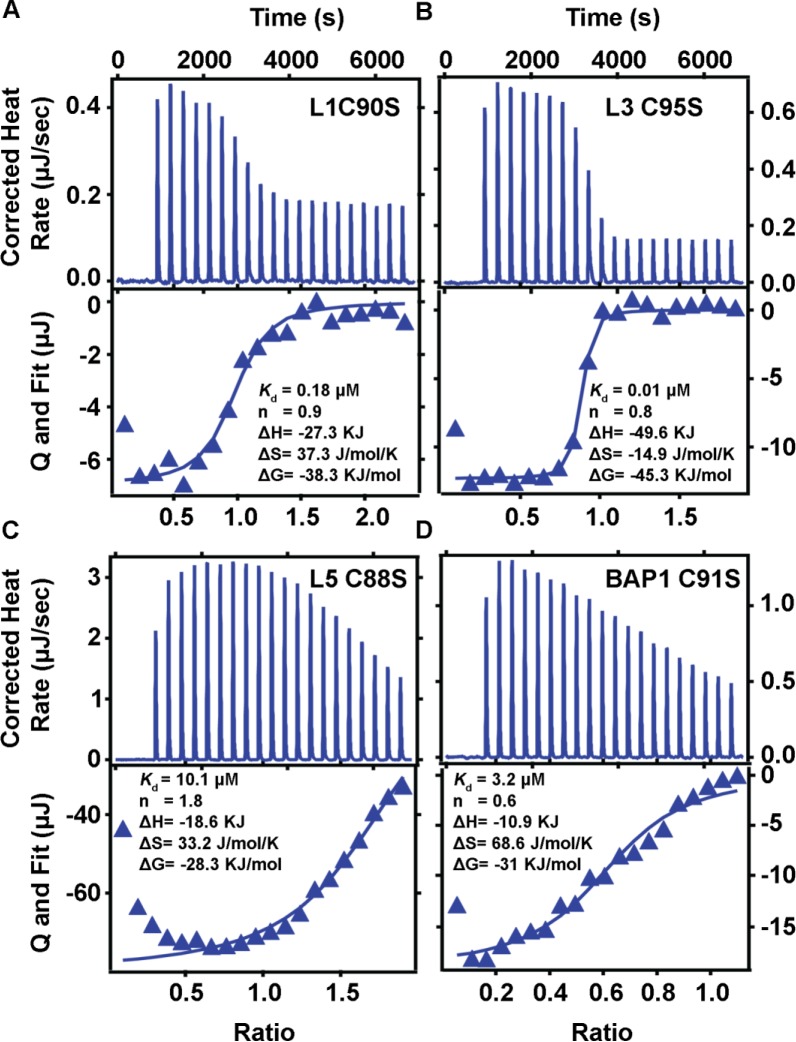
Figure 6. Binding isotherm of the titration of catalytic mutants of UCHL1, UCHL3, UCHL5, and BAP1N with ubiquitin.
Data acquisition and quantitative analysis of the ubiquitin binding of UCHs were performed on TA-ITC instrument. ITC profile for the binding of ubiquitin to (A) UCHL1 C90S (10 μM) with ubiquitin (100 μM), (B) UCHL3 C95S (10 μM) with ubiquitin (100 μM), (C) UCHL5 C88S (250 μM) with ubiquitin (2.5 mM) and (D) BAP1N C91S (120 μM) with ubiquitin (1.2 mM) was obtained at 25°C. The top panel for each figure shows the raw data, and the lower panel shows the integrated heat data as enthalpy as a function of molar ratio of ligand to protein. The solid line in the bottom panel represents the best curve fit to the data by using one-site binding model.

