
Figure 4. Effect of FRG1 expression on cell signaling molecules.
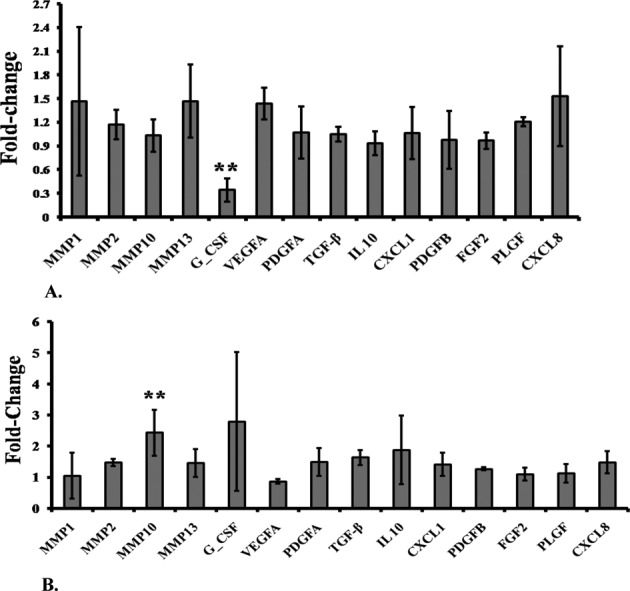
(A) qRT-PCR expression analysis shows effect of FRG1 expression on levels of various cytokines and MMPs, in HEK293T cells, transfected with FRG1 expression vector, compared with empty vector control. (B) Expression analysis of various cytokines and MMPs, in HEK293T cells with FRG1 knockdown, compared with scrambled vector control; X-axis shows the name of various signaling molecules and Y-axis shows the fold-change in expression of these molecules compared with their controls. ** represents P<0.01.