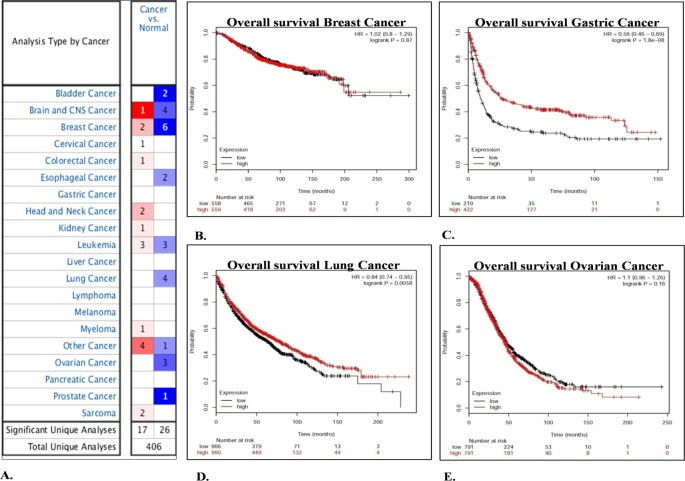
Figure 5. Determination of FRG1 expression levels and prognostic value by in silico analysis.
(A) Shows FRG1 gene summary overview by Oncomine analysis. The view represents FRG1 expression in various tumor compared with normal datasets. The blue color represents down-regulation of FRG1 levels and red color represents up-regulation of FRG1 expression in a particular number of datasets. Intensity of color represents the level of up-regulation or down-regulation. (B–E) Represent Kaplan–Meier plotter analysis of (B) breast cancer, (C) gastric cancer, (D) lung cancer, and (E) ovarian cancer. Red line shows patients with expression above the median and black line shows patients with expression below the median. X-axis denotes the number of patients at risk with time in months and Y-axis denotes the probability of survival.

