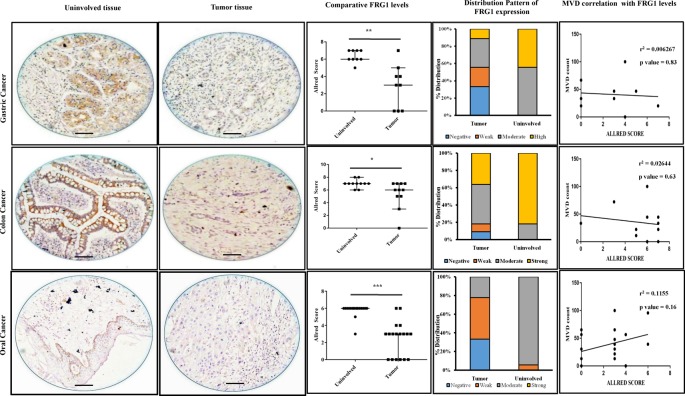
Figure 6. FRG1 levels and distribution pattern in tumor tissues and correlation with tumor MVD; top row represents gastric cancer, middle row represents colon cancer, and bottom row represents oral cavity cancer.
First two columns show representative images of FRG1 staining in uninvolved tissue and tumor tissue, respectively. The third column illustrates comparison of Allred score for FRG1 staining, between uninvolved tissue and tumor tissue. * represents P<0.05, ** represents P<0.01, *** represents P<0.0001. Distribution of staining pattern for the above-mentioned tumor types is represented by the fourth column. Last column represents correlation analysis between tumor, FRG1 staining Allred score, and MVD count.

