. 2017 Nov 1;6:e29388. doi: 10.7554/eLife.29388

Figure 5. CHIP reorganizes cellular proteome and architecture.

(a) Inhibition of phospholipase D (PLD) releases EGFP-CHIP-K30A from cellular membranes. FIPI, isoform independent inhibitor of PLD; VU0155069 and CAY10594, inhibitors of PLD1 and PLD2, respectively. Scale bar 20 mm. *p<0.05, chi-square analysis; N = 4 independent experiments (mean ± SD). (b) Interactors of EGFP-CHIP-K30A in transiently transfected murine embryonic fibroblasts (MEF). Phospholipase D was inhibited using 500 nM VU0155069. EGFP pulldowns were prepared as detailed in Methods and label-free mass spectrometry was used to quantitate proteins associated with CHIP. N = 5 biologically independent experiments. Volcano plots indicate average enrichment of individual protein levels. Red color marks significantly enriched proteins as determined by two sample t-test (p-value<0.05) (c) Minimal overlap of CHIP interactors from control and upon phospholipase D inhibition visualized by a venn diagram. (d) Subcellular localization of CHIP interactors as assigned by GeneCards database (www.genecards.org). According to the database, proteins may display multiple localizations. The scales of y-axis were adjusted according to the interactome sizes (19 versus 47). (e) Label-free quantitative mass spectrometry was used to determine proteome changes in MEFs upon overexpression of CHIP for 24 hr (N = 4). Volcano plot indicates average changes of individual protein levels. Red color marks significantly changed proteins as determined by two sample t-test (p-value<0.05). (f) GOBPslim terms enriched above two in the group of proteins significantly changed upon CHIP overexpression. Fisher exact test was used to determine statistical significance. (g) Morphology of the Golgi apparatus upon transient CHIP overexpression in MEFs assessed by co-transfected Golgi marker. DAPI stain in blue. Scale bar 5 mm. ***p<0.001, chi-square analysis; N = 3 independent experiments (mean ± SD). (h) Fragmentation of Golgi apparatus during heat shock in wild-type (WT) and CHIP knock-out MEFs (CHIP K.O.). Fraction of cells with fragmented Golgi at 37°C was set to 1. Increase of cells with fragmented Golgi after 30 min at 43°C is plotted as mean ± SD from three independent experiments. **p<0.01, t-test analysis.

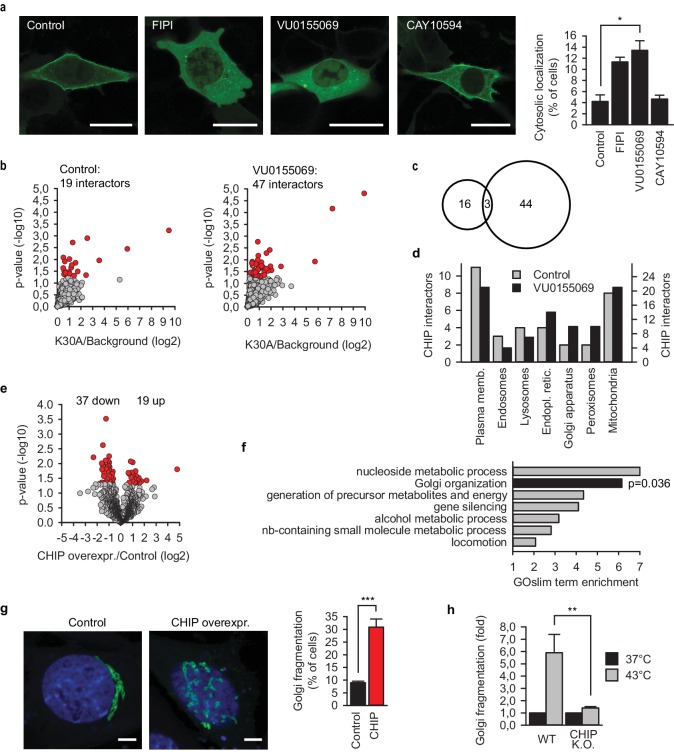
Figure 5—source data 1. LFQ of EGFP-CHIP-K30A interactors under the specified conditions.
Mass spectrometry raw files were processed with MaxQuant as detailed in Materials and methods.
DOI: 10.7554/eLife.29388.012
Figure 5—source data 2. Significantly enriched proteins in EGFP-CHIP-K30A pull-downs.
Quantification was performed using label-free mass spectrometry. p<0.05, two-sample t-test analysis; N = 5 biologically independent experiments. Control, DMSO-treated samples; PLD inhibitor, 500 nM VU0155069-treated samples.
DOI: 10.7554/eLife.29388.013
Figure 5—source data 3. LFQ of proteome changes under the specified conditions.
Mass spectrometry raw files were processed with MaxQuant as detailed in Materials and methods.
DOI: 10.7554/eLife.29388.014
Figure 5—source data 4. Significant proteome changes upon CHIP overexpression in murine embryonic fibroblasts.
Quantification was performed using label-free mass spectrometry. p<0.05, two-sample t-test analysis; N = 4 biologically independent experiments.
DOI: 10.7554/eLife.29388.015

Figure 5.

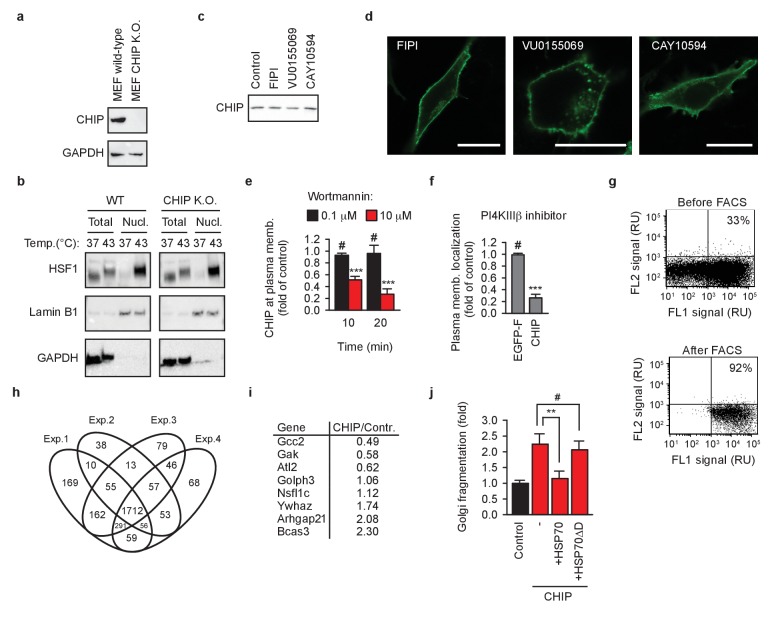
Figure 5—figure supplement 1. Cellular reorganization by chaperone-free CHIP.

Figure 5—figure supplement 1.

(a) Murine embryonic fibroblasts (MEF) lacking CHIP (CHIP K.O.) were engineered using CRISPR/Cas9 system. GAPDH was used as loading control. (b) HSF1 translocation into nucleus after 60 min at 43°C was analyzed by means of nuclei isolation as detailed in Materials and methods. Lamin B1 and GAPDH were used as markers of nuclei and cytosol, respectively. One representative out of three independent experiments is shown. (c) Phospholipase D inhibitors do not affect steady-state levels of transiently transfected EGFP-CHIP-K30A in MEFs as determined by western blotting. Samples were normalized to have the same protein concentration before loading on gel. One representative out of three independent experiments is shown. (d) Phospholipase D inhibitors do not affect membrane localization of transiently transfected farnesylated EGFP in MEFs. One representative out of three independent experiments is shown. Scale bar 20 μm. (e) Inhibition of type III phosphatidylinositol-4 kinases (PI4KIII) by wortmannin causes an acute undocking of EGFP-CHIP-K30A from cellular membranes (mean ± SD). ***p<0.001, # indicates no significant difference, t-test analysis; N = 3 independent experiments. (f) Inhibition of PI4KIIIβ by its specific inhibitor IN-10 for 20 min undocks EGFP-CHIP-K30A, but not farnesylated EGFP (EGFP-F) from cellular membranes (mean ± SD). ***p<0.001, # indicates no significant difference, t-test analysis; N = 3 independent experiments. (g) EGFP and CHIP co-transfected MEFs were sorted using FACS to enrich the transfected population from 33% to 92%. One representative out of four independent experiments is shown. The sorted cells were lysed and analyzed by quantitative mass spectrometry as detailed in Materials and methods. (h) Overlap of identified proteins in four biologically independent experiments. (i) Average changes of quantified proteins from GOBPslim group ‘Golgi organization’. N = 4 biologically independent experiments. (j) Inhibition of the Golgi fragmentation by co-transfected HSP70, but not by HSP70 mutant with altered CHIP-binding tail (HSP70ΔD) (mean ± SD). **p<0.01, # indicates no significant difference, t-test analysis; N = 3 independent experiments.