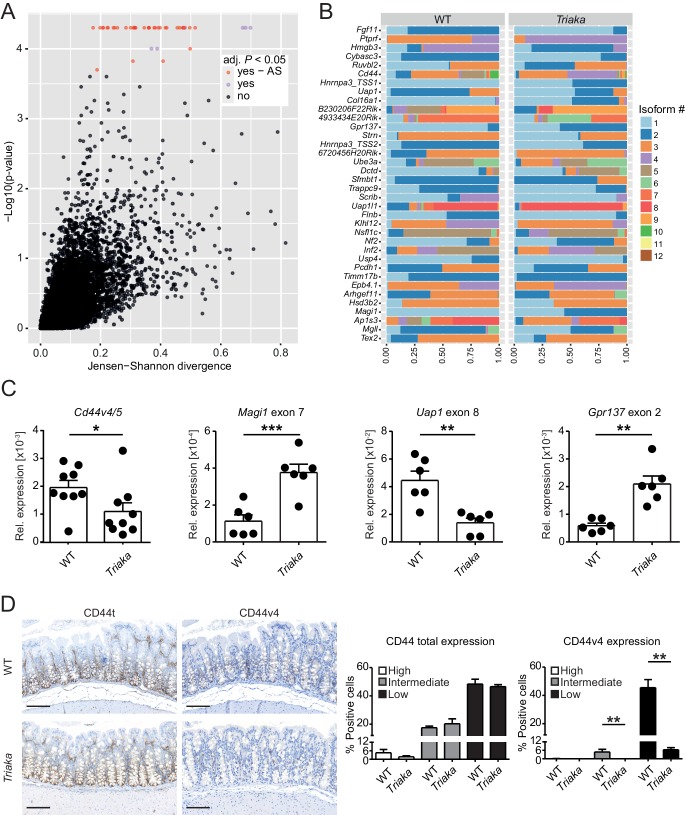
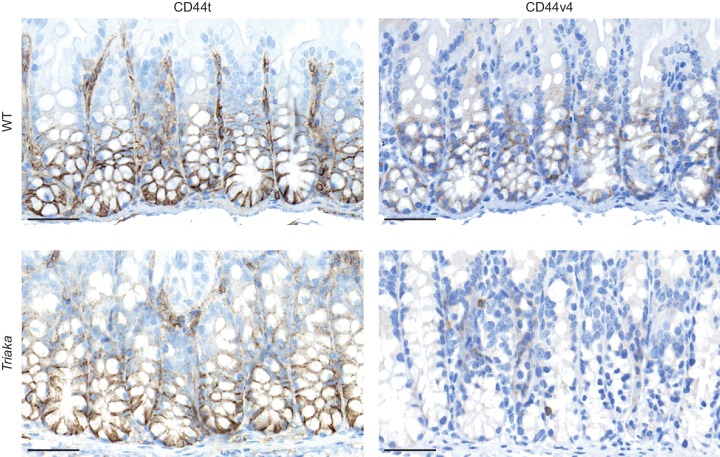
Figure 2. Esrp1Triaka alters mRNA splicing patterns in colonic intestinal epithelial cells.
(A) RNA sequencing analysis was performed on colonic intestinal epithelial cells (cIECs) isolated from WT and Triaka mice. Dot plot indicating the relative difference in isoform usage for a given transcription start site expressed as Jensen-Shannon divergence and the associated p-values. Analysis was performed through CummeRbund and FDR-adjusted p-value<0.05 were considered significant. Red and orange dots represent genes with differences in transcript isoforms generated by bona fide alternative splicing (AS) events or by other mechanisms, respectively (n = 4 donor mice per group). (B) Panel showing the relative frequency of the different isoforms identified as AS events in (A) for 36 transcription start sites and from 35 genes, in WT versus Triaka cIECs. (C) Transcript levels for the indicated isoforms were measured in WT and Triaka cIECs using qPCR and normalized to Gapdh expression (n = 6–11 mice per group). Cd44v4-5: Cd44 variant 4–5. (D) Immunohistochemistry was performed on colonic tissue of indicated mice to detect total CD44 (CD44t) or CD44v4. Representative pictures and percentage of positive cells for the indicated staining intensities are shown (n = 5–6 mice per group, pooled from three independent experiments). Histograms represent the mean ± standard error of the mean. Statistics: (C) Student's t test; (D) Mann-Whitney test. *p<0.05; **p<0.01; ***p<0.001; ****p<0.0001.


