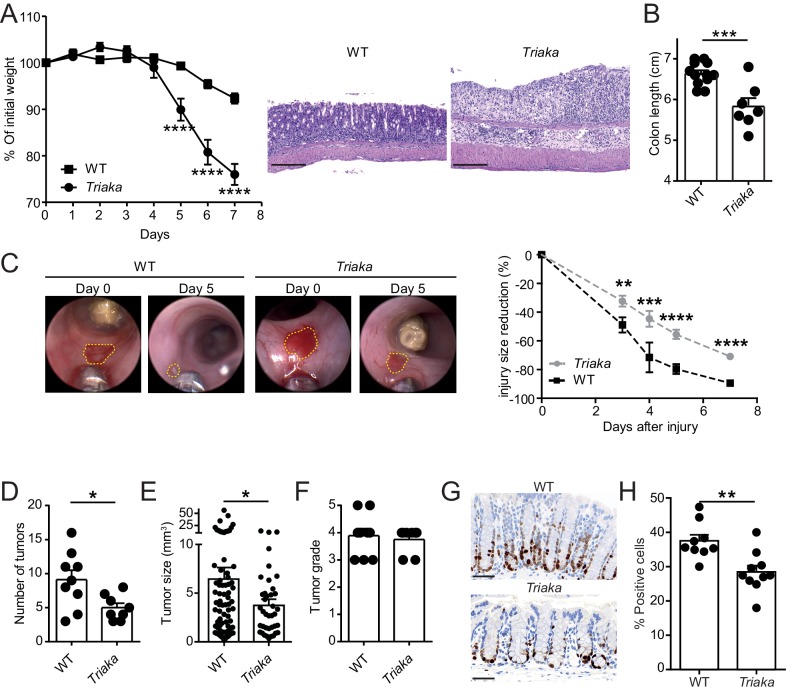
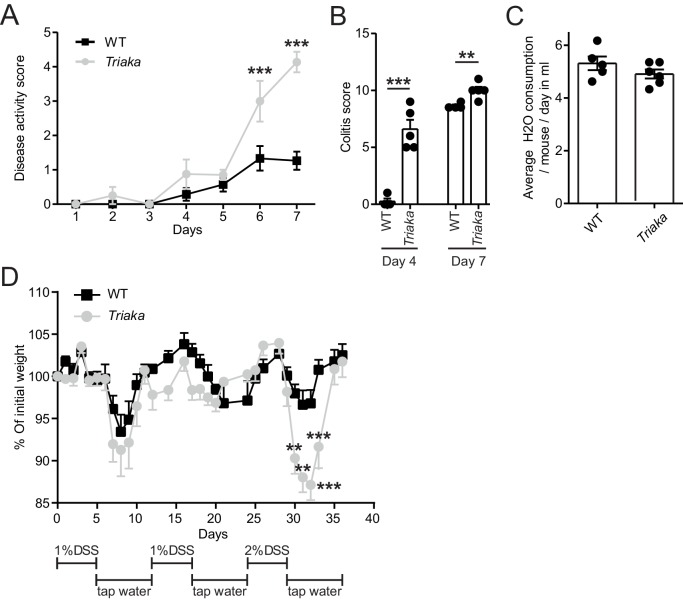
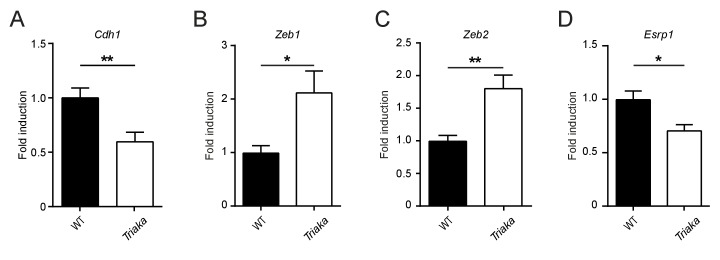
Figure 4. Esrp1Triaka modulates the course of experimental intestinal immunopathology.
(A) WT (n = 7) and Triaka (n = 4) mice were challenged with 2% DSS in the drinking water for 7 days. Weight loss was measured daily (left panel). One representative out of four different experiments is shown. Representative H&E slides from colonic sections illustrate the degree of pathology in the different groups 7 days after the start of DSS treatment (right panel). Scale bars: 200 µm. (B) Colon length was measured in DSS-treated mice (n = 7–12 mice per group). (C) A miniature forceps was used to induce injuries in the colonic mucosa of the indicated groups of mice. Wound-healing was monitored by colonoscopy. Representative pictures (left panel) and quantification of wound-healing over time (right panel) are shown. Right panel represents pooled data from four independent experiments (n = total of 17 wounds from 8 to 9 mice, per group). (D) WT and Triaka mice were treated with AOM/DSS and sacrificed. Number of tumors, (E) tumor size and (F) the highest tumor grade per mouse are shown, assessed 70 days after the initial AOM injection. For (D), (E) and (F), one representative experiment of two is shown (n = 8–9 mice per group). (G) WT and Triaka mice were treated with 2% DSS in the drinking water for 3 days and Ki-67 staining was performed. Representative pictures are shown and (H) Ki-67-positive cells were quantified (n = 9–10 mice per group). Statistics: (A) and (C) Two-way ANOVA with Bonferroni post-test, (B) and (H) Student's t test, (D) Mann-Whitney test and (E) Student’s t test with Welch’s correction. *p<0.05; **p<0.01; ***p<0.001; ****p<0.0001.


