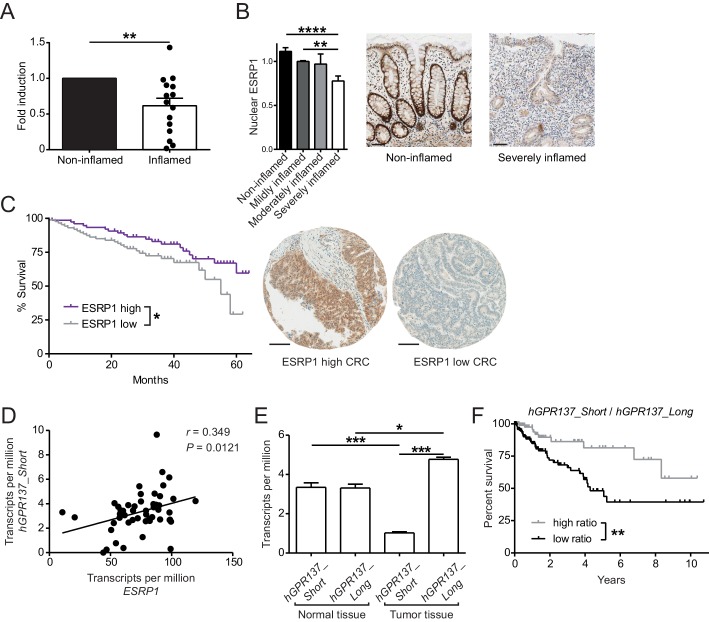
Figure 6. Expression of ESRP1 and ESRP1-dependent hGPR137 isoforms is down-regulated in the diseased intestine and predicts CRC patient survival.
(A) ESRP1 transcript levels were measured in inflamed versus matched, non-inflamed intestinal biopsies from Crohn’s disease (CD) patients and normalized to EPCAM expression. Normalized ESRP1 transcript levels in the non-inflamed biopsy were set to one for each patient and fold induction was calculated for the corresponding inflamed biopsy (n = 15 samples per group). Data represent means ± standard error of the mean. (B) Immunohistochemistry was performed on intestinal tissue of CD patients to detect nuclear ESRP1, which was measured using automated quantification and normalized. Representative pictures are shown from a patient during remission and active disease, respectively (n = 31, 32, 7 and 14 biopsies per indicated group of cases). Data represent means ± standard error of the mean. Scale bars: 50 µm. (C) Kaplan-Meier survival curves of CRC patients with high (n = 77) or low (n = 88) expression of ESRP1 in tumor tissues. Representative IHC showing ESRP1-high and -low intestinal tumors. Scale bars: 100 µm. (D) Correlation between ESRP1 and hGPR137_Short expression in normal tissue of the large intestine (n = 51). (E) hGPR137_Short and hGPR137_Long isoform expression in tumor (n = 647) versus normal (n = 51) tissue of the large intestine. Data represent means ± standard error of the mean. (F) Kaplan-Meier survival curves of CRC patients with a high (n = 142) or low (n = 261) ratio of hGPR137_Short to hGPR137_Long transcripts in tumor tissues. Statistics: (A) Wilcoxon signed-rank test, (B) One-way ANOVA with Bonferroni post-test, (C) and (F) Log-rank test, (D) Spearman correlation, (E) Kruskal-Wallis with Dunn’s post-test. *p<0.05; **p<0.01; ***p<0.001; ****p<0.0001.


