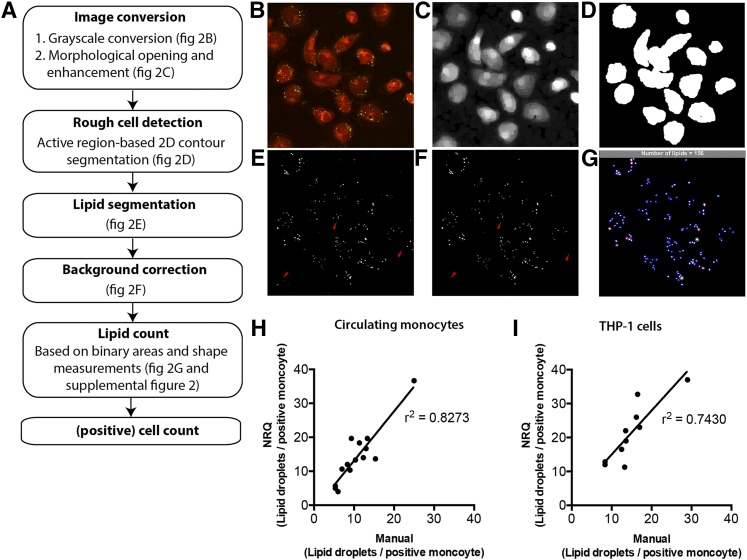
Fig. 2.
Processing steps and validation of the NRQ. A: Overview of processing steps of NRQ. B: Original image of the NR-stained monocytes. C: After converting it to grayscale, morphological opening of the grayscales and enhancement is created. D: Image (B) is then used to segment the cells with a region-based active contour method. E: Segmentation of the original image using a HSV color coding segmentation. F: After background correction using image (C), image (F) is obtained. Segmented lipid areas are then calculated with the aid of shape measurements (supplemental Fig. S3A–E). G: Counted areas are visualized with a blue circle, areas counted as two show an additional red circle, whereas areas counted as three are indicated with a green circle. The total amount of calculated LDs is shown in the gray bar; H, I: Pearson’s correlation between manual and NRQ quantification of LDs in circulating monocytes (H) and THP-1 cells (I) using 10–14 independent images.

