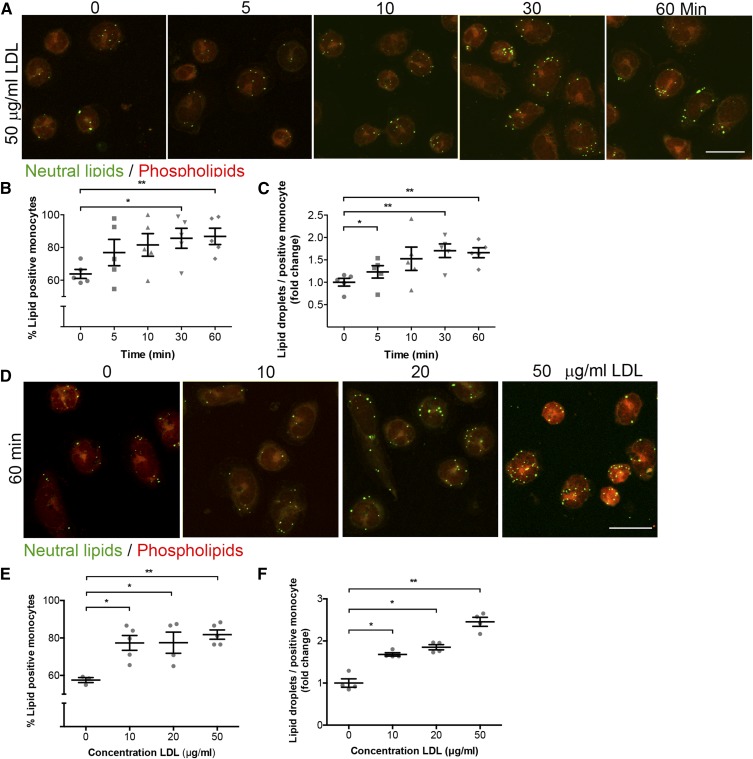
Fig. 3.
NR detection of LDs in monocytes in a time- and dose-dependent manner. A: Representative images of monocytes treated with 50 μg/ml LDL at different time points, as indicated. Scale bar, 10 μm. LDs and phospholipids are shown in green and red, respectively. B: Quantification of LD-positive monocytes after NR staining. C: Quantification of the amount of neutral LDs per positive monocyte after NR staining. D: Representative images for dose-dependent uptake of different concentrations of LDL, as indicated, for 1 h. Scale bar, 10 μm. LDs are shown in green, phospholipids in red. E, F: Quantification of dose dependency experiments in amount of LD-positive monocytes (E) and number of LDs (F) per LD-positive monocyte. P < 0.05 is considered significant. Data are shown as mean ± SEM for n = 5–7 independent experiments.

