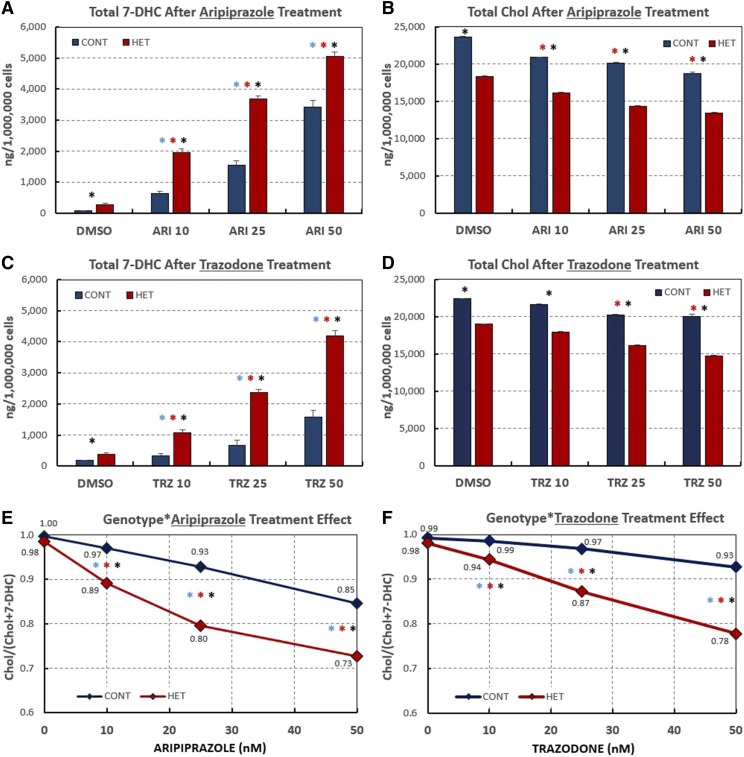
Fig. 4.
Human DHCR7-HET fibroblasts are preferentially affected by exposures to DHCR7 inhibitors. Summary of 7-DHC and Chol levels in HF in response to various concentrations of ARI and TRZ. A, C: Graphs show average 7-DHC levels in nanograms per million cells for six DHCR7-HET and four CTR HFs. B, D: Graphs show average Chol levels in nanograms per million cells for six DHCR7-HET and four CTR HFs. E, F: Graphic representation of increasing amount of 7-DHC and decreasing amount of Chol in response to increasing amount of ARI (E) or TRZ (F) as measured by the ratio [Chol]/[Chol +7-DHC]. Asterisks above the bars show P values <0.01 (blue is the difference among CTR samples; red is the difference among HET samples; and black is the difference between CTR and HET samples. Supplemental Tables S1A and S1B contain companion data for Fig. 4 showing mean, SD, and SEM, as well as P values.

