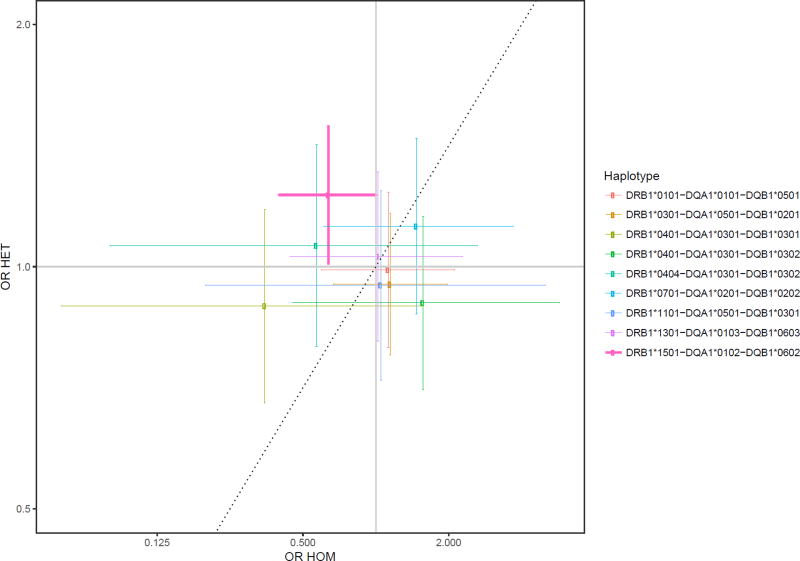
Figure 1.
Scatter plot of glioma risk for homozygous haplotype carriers plotted on the x-axis, and heterozygous haplotype carriers plotted on the y-axis. Associations are shown as the odds ratios for glioma risk in carriers compared to non-carriers of the haplotype. The dashed line represents a purely additive relationship, in which heterozygotes have half the risk of homozygotes (on a log-odds scale). The haplotype showing a non-additive effect is bolded.

