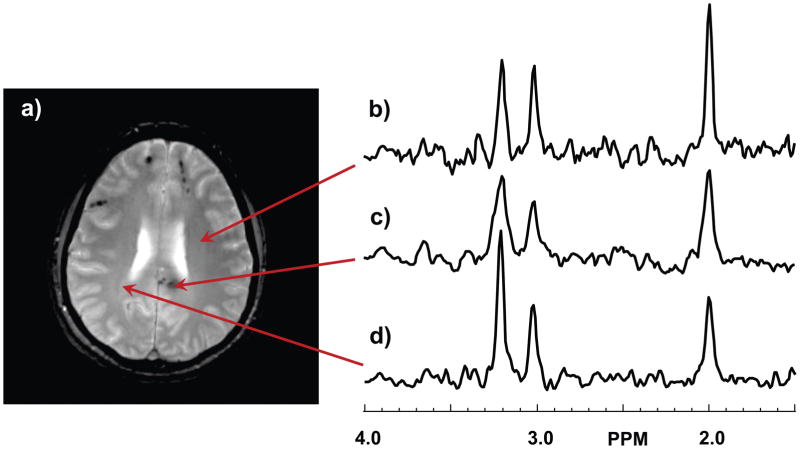
Figure 1.
Example spectra from the first time-point study. In (a) is shown the gradient-echo image at the slice from which example spectra were selected. Spectra are shown in (b) for a normal region of the brain, (c) at the site of a hemorrhagic lesion, and (d) at a location with no MRI-observed abnormality but with a spectrum indicating abnormal N-acetylaspartate and choline peaks. The vertical scale of the spectra are in arbitrary intensity units.

